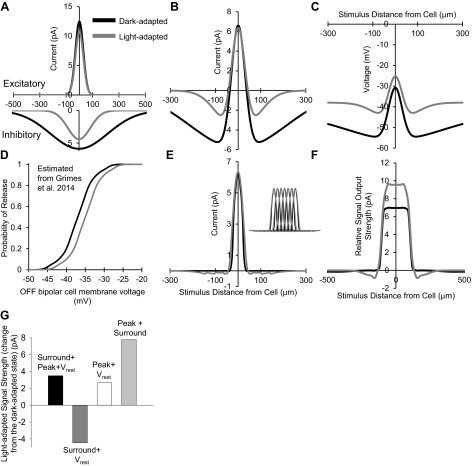
Fig. 10.
Light-adapted narrowing and reduction of spatial inhibition increases the modeled strength of OFF bipolar cell output. A: OFF bipolar cell excitatory center (top) and inhibitory surround (bottom) Gaussian distributions based on conductance-adjusted scaled peak amplitudes. There was no significant change in excitatory center spatial distributions with light adaptation; however, the light-adapted inhibitory spatial distribution became smaller and narrower. B: difference of excitatory and inhibitory Gaussian distributions. Inhibition had less impact on the OFF bipolar cell center-surround distribution in light-adapted conditions than in dark-adapted conditions. C: calculated simulated potentials from the excitatory postsynaptic potentials caused by a current from the center-surround distributions. Under light-adapted conditions, the combination of excitatory and inhibitory current inputs depolarizes the OFF bipolar cell more at a given stimulus distance than under dark adaptation. D: OFF bipolar cell release probability based on values obtained from Fig. S4Ain Grimes et al. (2014) for rod bipolar cells. Dark-adapted release values were estimated from the rod bipolar cell release curve at a membrane voltage of ∼44 mV, and light-adapted release values were estimated from the rod bipolar cell release curve at a membrane voltage of ∼39 mV. E: threshold- and release-corrected center-surround distributions in the dark- and light-adapted conditions. Inset: 7 threshold/release-corrected bipolar cell center-surround current distributions constructed with the center peak of each cell 30 μm apart, summed to obtain total bipolar cell output. F: model of the total current output of 7 summed threshold/release-corrected OFF bipolar cell receptive fields (correlated to the input the OFF ganglion cell would receive). This bipolar cell signal strength represents the probability that the collective OFF bipolar cell group comprising the center receptive field of the OFF ganglion cell would cause release leading to a voltage change in the ganglion cell. Light adaptation increases the strength of the input to the OFF ganglion cell excitatory center to small stimuli. G: light-adapted signal output strength under several model manipulations plotted as the change from the dark-adapted state. Dark-adapted signal strength increased with light adaptation (black bar) when the surround, peak, and Vrest changes were included. When only bipolar cell peak L-IPSC magnitude changes were excluded, the signal strength decreased from dark-adapted conditions (dark gray bar). When only bipolar cell surround size changes were excluded, the signal strength increased from dark-adapted conditions, but less so than in normal conditions (white bar). Finally, when only Vrest changes were excluded, the signal strength increased past normal light-adapted changes (light gray bar). Both the surround size and peak changes are important for increasing the light-adapted signal strength, whereas the change in Vrest limits the extent of the increase.

