Fig. 2.
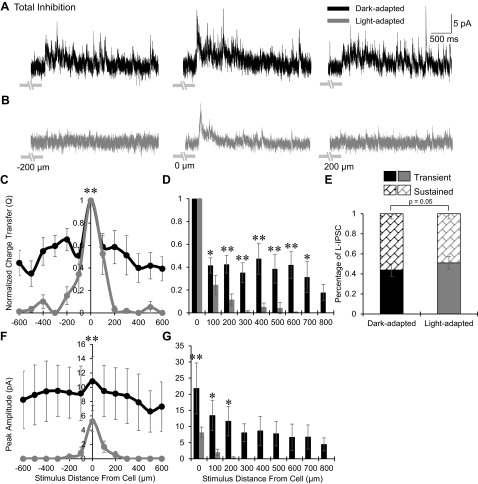
Light adaptation narrows the total spatial inhibitory input to OFF bipolar cells. A and B: example L-IPSCs recorded from an OFF type 3 bipolar cell in dark- and light-adapted conditions (CW = 67, CM = 0.971), black and gray traces, respectively, in response to a 1-s flash of a 25-μm bar of light, presented at −200, 0, and 200 μm away from the recorded cell. Light adaptation greatly reduced L-IPSCs 200 μm away from the OFF bipolar cell and decreased the center L-IPSC. Light stimulus is indicated by gray disconnected bars below L-IPSCs; OFF type 3 bipolar cells respond at the offset of light. C: spatial inhibition curves of Q, normalized to the center bar stimulus, in dark (n = 8)- and light (n = 5)-adapted conditions. The spatial inhibitory distribution became significantly narrower with light adaptation. D: L-IPSC Q, normalized to the center L-IPSC, compared between dark (0–300 μm, n = 17; 400–800 μm, n = 8)- and light (0–300 μm, n = 14; 400–800 μm, n = 5)-adapted conditions at each stimulus distance. The proportion of inhibition was significantly smaller after light adaptation starting at 100 μm away from the cell, after which there was little to no inhibition present. E: the average proportion of center L-IPSC response that is transient or sustained in dark- and light-adapted conditions (n = 14). L-IPSCs became significantly more transient with light adaptation. F: spatial inhibition curves of peak amplitude in the dark- and light-adapted conditions. The peak amplitude distribution was significantly narrower and smaller with light adaptation. G: L-IPSC peak amplitude compared between dark- and light-adapted conditions at each stimulus distance. The proportion of inhibition was significantly smaller under light adaptation at 0–200 μm away from the cell, after which there was no inhibitory input present. *P < 0.05; **P < 0.01.

