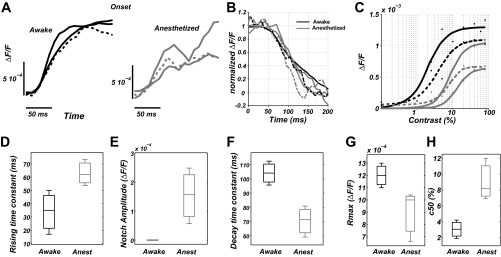
Fig. 5.
Experimental VSD data. A, left: onset of averaged experimental VSD responses obtained in awake (solid line) and control (dashed line) protocols (3 awake monkeys) in response to full-field drifting gratings at high contrasts. Right: onset of averaged experimental VSD responses obtained in anesthetized (solid line) and control (dashed line) protocols (3 anesthetized monkeys) in response to full-field drifting gratings of high contrasts. B: offset of the averaged experimental VSD responses (2 awake monkeys and 3 anesthetized monkeys). Same color/linestyle code as in A. C: experimental contrast response function for awake (black lines) and anesthetized (gray lines) states. Each trace has been fitted with a Naka-Rushton function (see materials and methods, Eq. 6). Dashed lines correspond to the contrast response function of the same monkey enrolled in the control protocol, i.e., before (black, awake state) and after (gray, drowsy state) midazolam administration. Boxplot diagrams revealing the difference in rising time constant (D); DA notch amplitude (E); decay time constant (F); Rmax (G); and C50 (H) between awake (black) and anesthetized (gray) conditions are shown.

