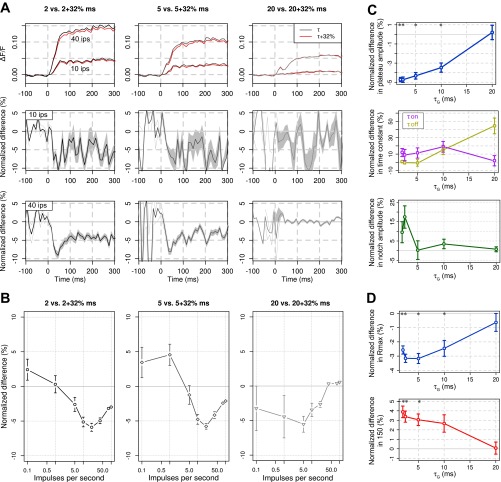
Fig. 6.
RH1691 specific effects on the modeled VSD signal. A, top: VSD responses before (gray-scale traces) and after (red traces) a 32% modulation of τG (2, 5, and 20 ms are plotted in columns) for 2 thalamic input rates (10 and 40 ips). Corresponding normalized differences [df = (fmod − f)/f] are plotted at bottom, where shaded gray areas represent means ± SE. B: similarly to the VSD dynamics, normalized differences of the input response function of the VSD signal are computed and plotted here for the three different values of τG (2, 5, and 20 ms, gray-scale and markers). C: statistical effect of a 32% prolongation of τG on the principal VSD time course characteristics. The normalized differences in plateau amplitude (blue), time constants (τon and τoff, pink and yellow), and notch amplitude (green) are respectively shown in top, middle, and bottom. D: statistical effect of a 32% prolongation of τG on the input response function parameters. The normalized differences in Rmax (blue) and I50 (red) are, respectively, shown at top and bottom. Error bars are means ± SE. *Significant differences (see materials and methods, P < 0.01).

