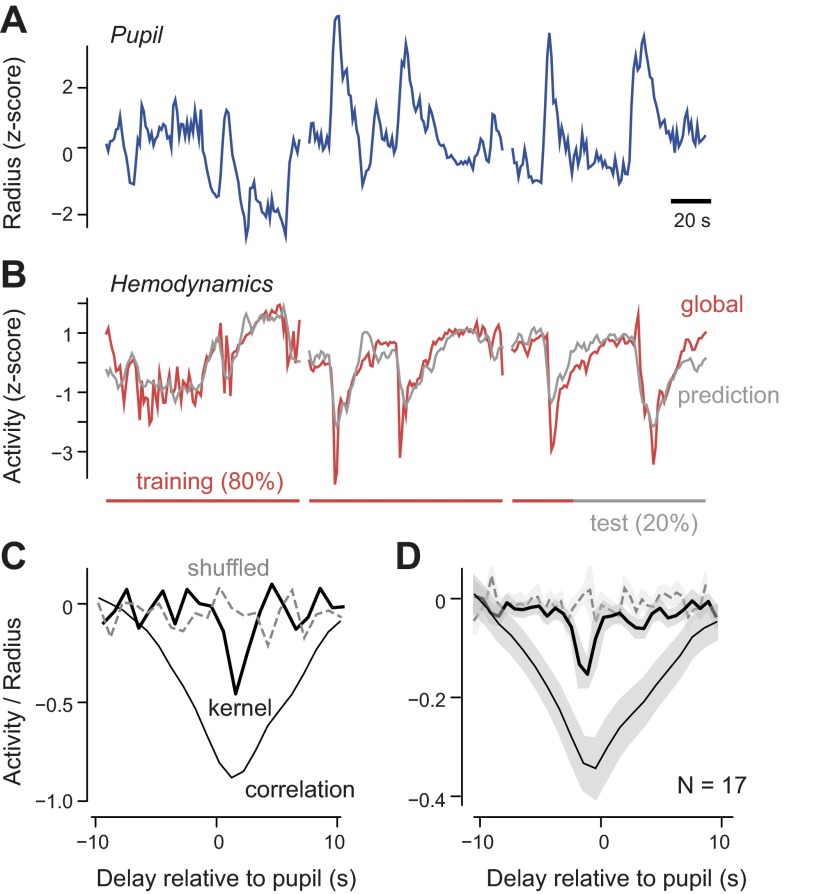
Fig. 3.
Relationship between pupil dilations and global hemodynamic activity. A: 3 consecutive recordings of pupil dilations. Traces are briefly interrupted between recordings. B: simultaneously measured global fluctuations of the hemodynamic activity (red). The prediction for the global hemodynamics (gray) is obtained by convolving the kernel (black trace in C) with the pupil radius trace. The kernel is computed over a training set of 80% of the data (red bar) but also predicts the test data (black bar). All traces in A and B are z-scored and therefore dimensionless. C: correlation between pupil radius and global hemodynamics (thin black trace) and kernel predicting global hemodynamic activity computed from the trials in A and B (thick black trace) or computed by shuffling the trial number in the eye tracking experiment (gray dashed trace). D: average correlation between pupil radius and global hemodynamics (thin black trace) and average kernel predicting global hemodynamic activity from pupil dilations (thick black trace), in 17 experiments (n = 10 mice). When we shuffled the trial numbers in each eye-tracking experiment, the peak in the kernel disappeared (dashed trace).

