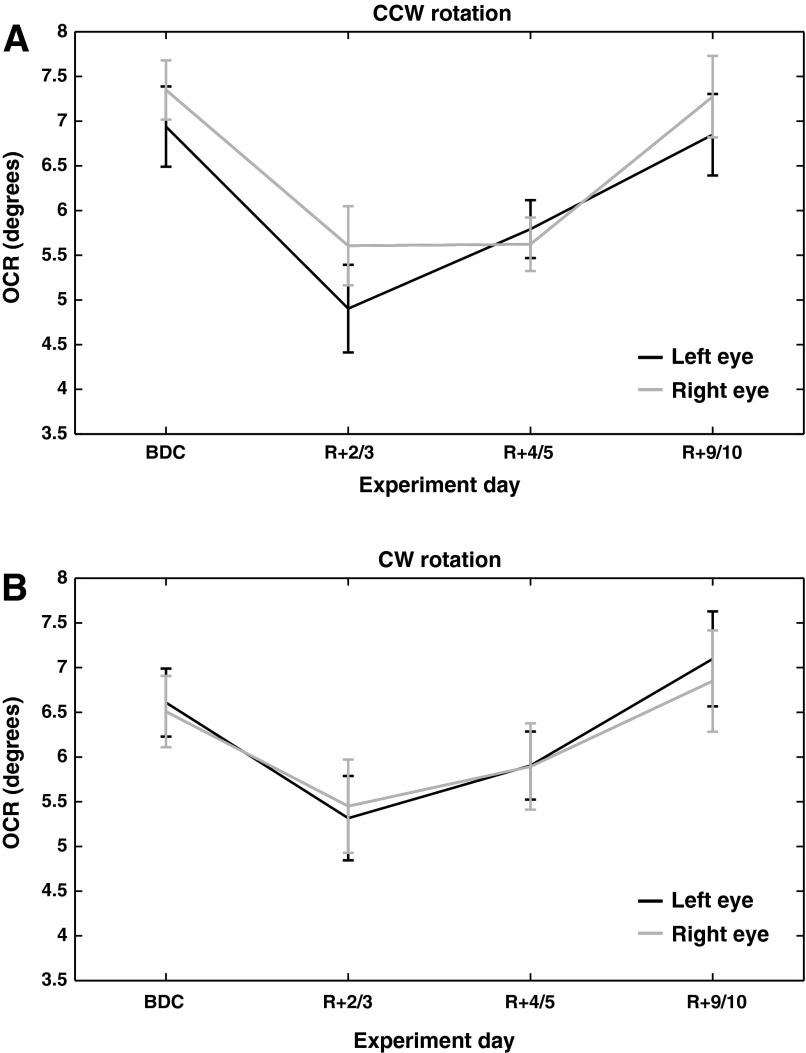
Fig. 4.
Alteration of OCR for the 2 directions of rotation and the 2 eyes separately: mean raw OCR values for the 2 directions of rotation divided into 2 graphs. Each graph represents the OCR for the 2 eyes separately. The mean raw OCR data are plotted together with the standard error. A: average OCR for the first direction of rotation, the CCW rotation, for the 25 astronauts. B: average OCR for the second direction of rotation, the CW rotation, for the 25 astronauts. The pure raw data (and not the mean OCR) were analyzed with a linear mixed model to investigate whether there were any differences in OCR between the 2 directions of rotation and between the 2 eyes.

