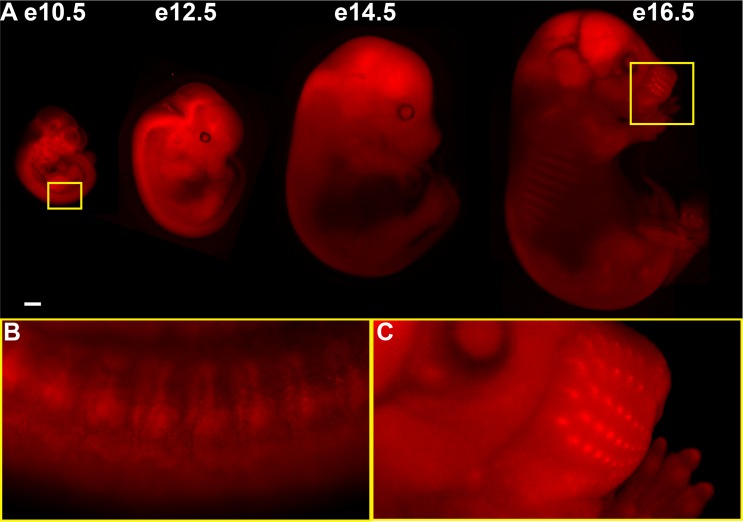
Fig 2. tdTomato fluorescence highlights BRAF expression in embryonic structures.
Native fluorescence (A) from various developmental stages of BrafTOM/+ embryos. (B) BRAF expression in dorsal root ganglia (DRGs). (C) BRAF expression in the hair follicles of the developing mouse snout. E12.5, E14.5, and E16.5 embryos demonstrate high levels of BRAF expression in the developing brain. Scale bars 1 mm.

