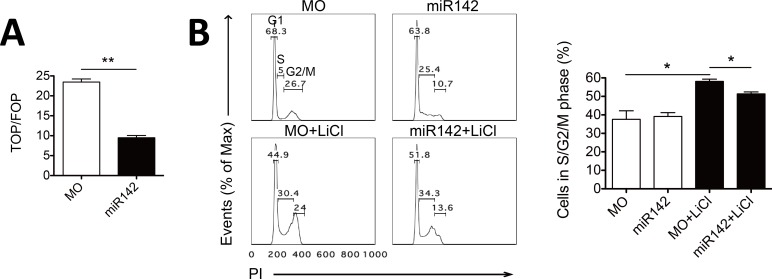
Fig 5. miR-142 represses cell proliferation.
(A) miR-142 and control (MO) stable NIH3T3 cell lines were transfected with the pGL3-TopFlash or pGL3-FopFlash vector and the pRL-TK vector as a normalization control. Cells were treated with 25 mM LiCl and lysed 24 h later for dual-luciferase analysis. Normalized TopFlash values were further divided by normalized FopFlash values; error bars mark the SEM (n = 2; **P < 0.01, t test). (B) Representative FACS histograms of propidium iodide (PI) staining of miR-142 and control (MO) stable NIH3T3 cell lines treated with or without LiCl (left) and the quantified percentages of cells in the S and G2/M phases respectively (right); error bars mark the SEM (n = 2; *P < 0.05, t test).

