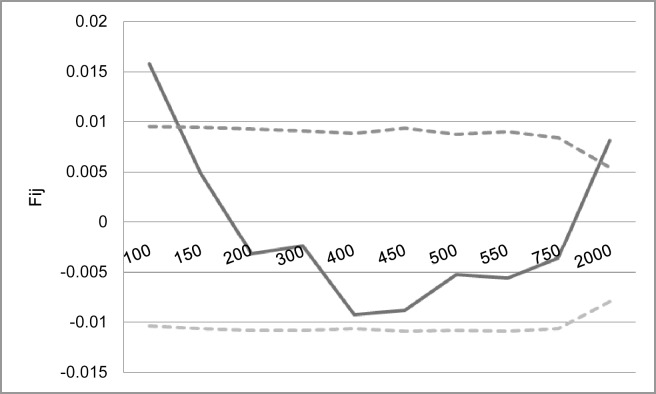
Fig 6. Results of spatial genetic structure analysis in the second intron S-alleles of P. africana.
Significant autocorrelation was detected in the first distance class (up to 100 m) between individuals. X-axis is spatial distance between individuals in metres, y-axis is Loiselle’s kinship coefficient for the second intron S-alleles

