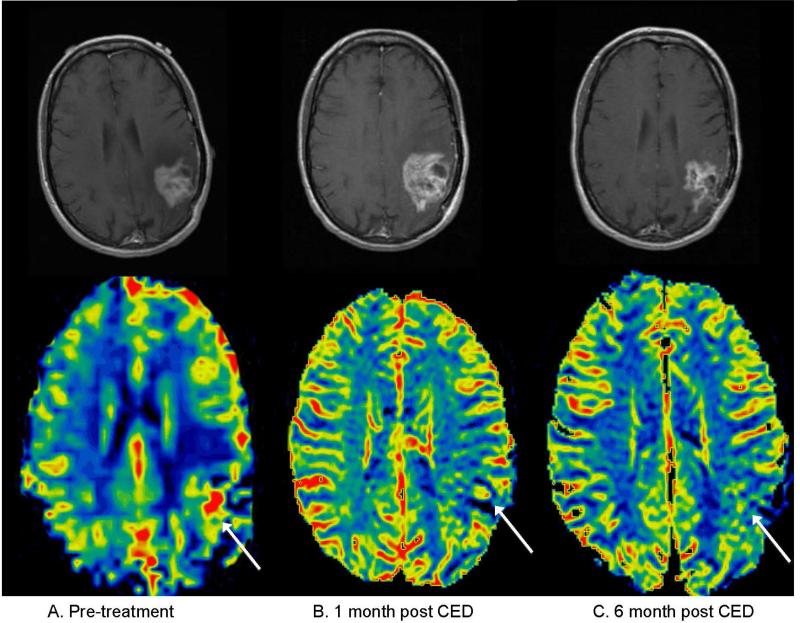
Figure 4.
Patient with pseudoprogression, meaning a transient increase in contrast-enhancing tumor volume was observed during the first five months after treatment, but the patient had non-progressive disease at six months. A) Pretreatment contrast enhanced T1 weighted sequence (top) and corresponding cerebral blood volume map (bottom), with white arrow highlighting region of maximum rCBV. B) One month post-treatment: there is an increase in eTV though with a decrease in rCBV compared to baseline. C) Six months post treatment, showing interval decrease in eTV and continued decline in rCBV.

