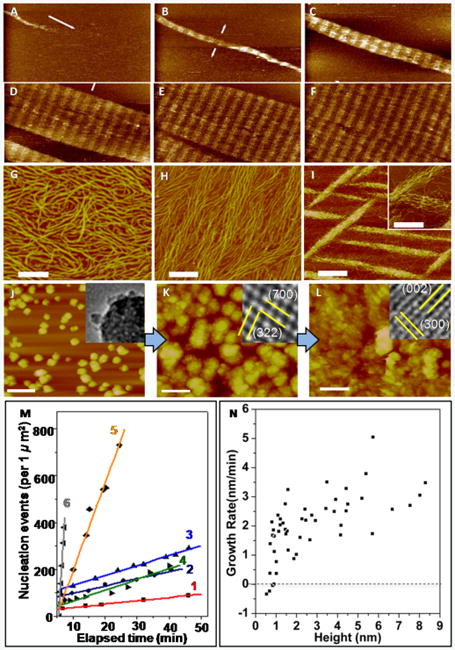
Figure 1.

In situ AFM can be used to investigate matrix self-assembly and mineralization. (A)–(F) Self-assembly of Type I collagen on mica into an ordered array with periodicity of 67 nm found in natural collagen. Times (min) are: (A) 12.9, (B) 25.8, (C) 43.0, (D) 55.9, (E) 60.2, and (F) 77.4. (G)–(I) Architecture of collagen on mica at pH 4.0 for K+ concentrations (mMol) of (G) 100 (H) 200 (I) 300. (J)–(L) Nucleation of calcium phosphate on collagen at a solute concentration above the ACP solubility limit. (J) ACP at 24 min then transforms to octacalcium phosphate at 64 min (K) and then HA at 98 min (L). Time 0 corresponds to the moment solution was injected into the atomic force microscopy fluid cell. Insets show transmission electron microscopy images collected on samples taken from the three stages of development. (M) Dependence of nucleation rate on time at six different supersaturations σi. Details of the supersaturation values can be found in Reference 8. Analysis of the data gives interfacial energies αi of αACP = 40 mJ • m−2 and αHA = 90 mJ • m−2. (N) Relationship between growth rate and particle height on surface of collagen with σHA = 3.31, σOCP = 1.71, σACP = –0.02. A critical size of 0.7 nm is determined from the zero crossing of the average growth rate (dashed line) All scale bars are 200 nm except in (I) where it is 500 nm in the main image only. Adapted and reprinted from 8 with permission from Elsevier. Reprinted with permission from Macmillan Publishers Ltd 11
