
Figure 2.
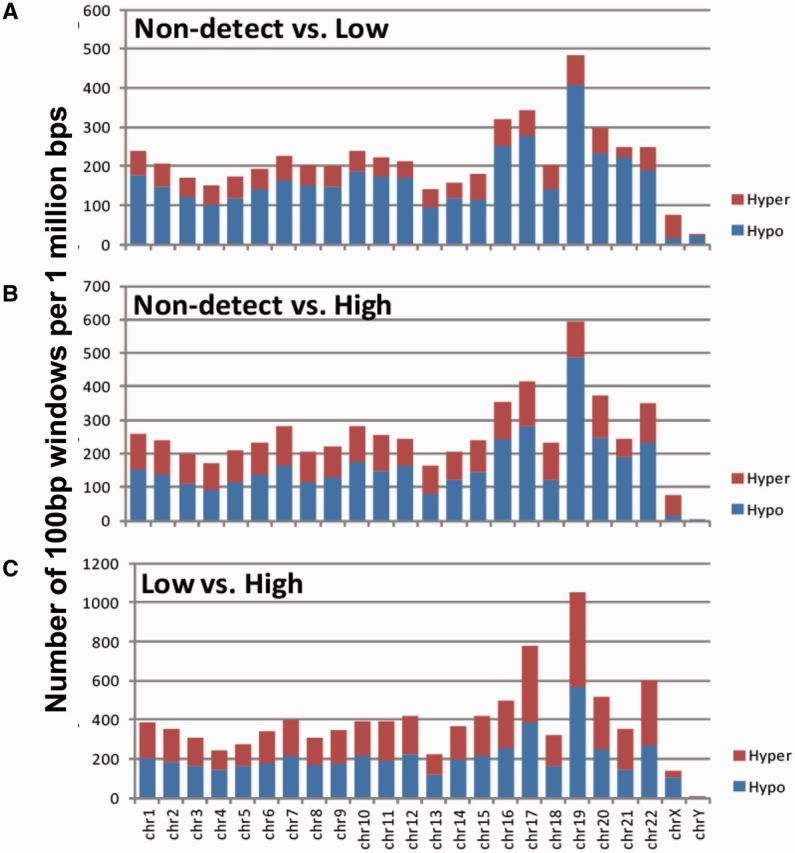
the chromosomal distribution of hyper-methylated (in red) and hypomethylated (in blue) sites as counted by 100 bp sliding windows per 1 million bp, normalized by chromosome length. (A) Number of windows in the non-detect vs. low groups are normalized to chromosome length and overall reflect the GC density of each chromosome. The majority of windows were hypo-methylated except for chromosome X. (B) Number of windows in the non-detect vs. high BPA groups, similar to (A). (C) Number of windows in low vs. high BPA groups shows a balanced number of hyper- to hypo-methylated regions. Overall data were not tested for significance