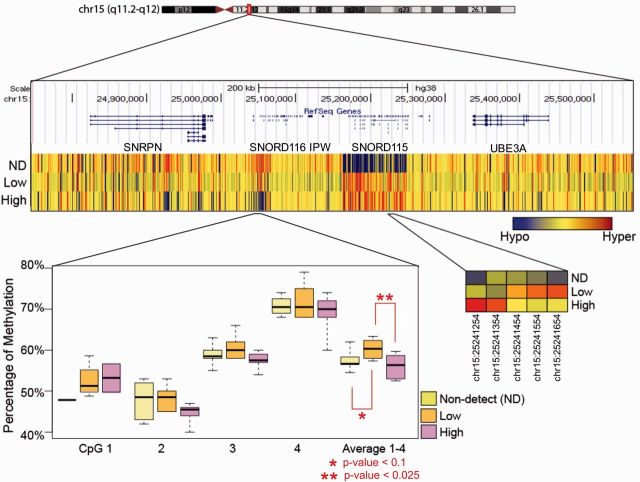
Figure 6.
differential methylation at the SNORD gene cluster on chr15. (A) Each row in the upper panel represents the average of the six samples in the group. ND, non-detected BPA; low, low BPA level; high, high BPA level. (B) Four CpG sites within the SNORD cluster were averaged for validation using pyrosequencing. Exact locations are listed in Supplementary Material and Table S2

