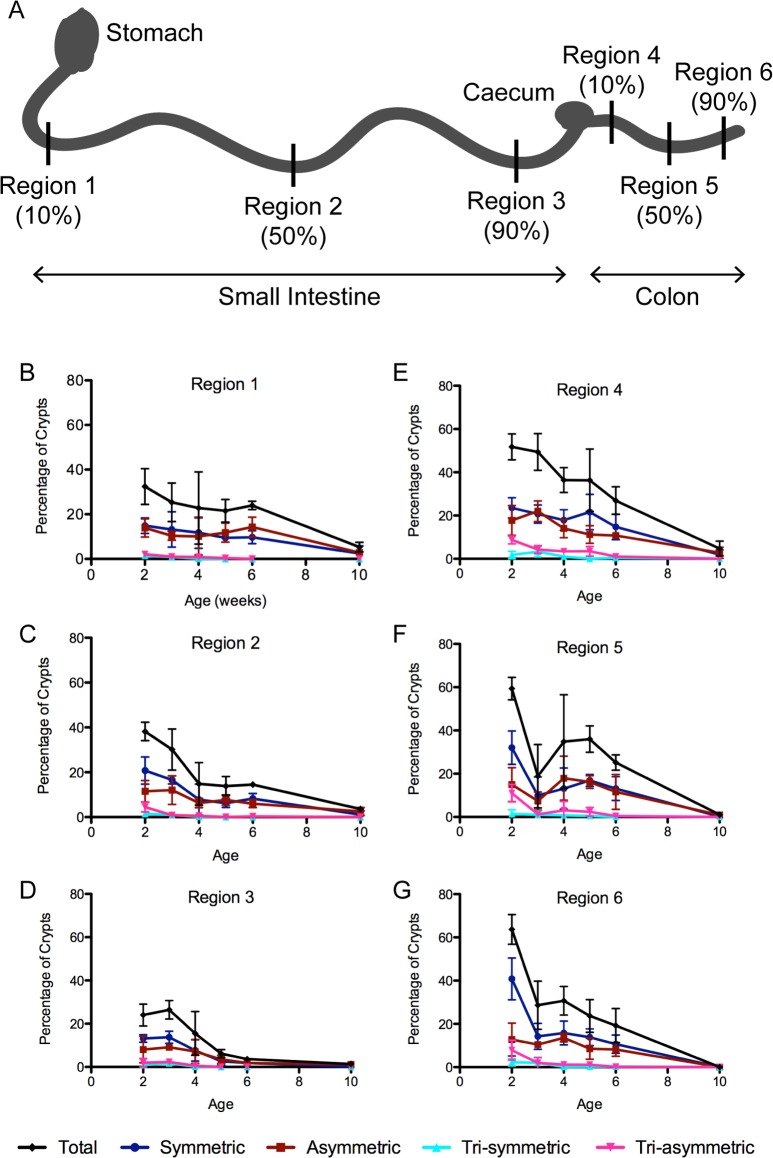
Fig 2. Incidence of crypt fission during postnatal development.
Crypts undergoing fission were counted in all regions (A) of the small intestine (B–D) and colon (E–G) isolated from mice aged 2, 3, 4, 5, 6, and 10 wk. Graphs show percentage of crypts undergoing fission and the proportions of different types of fission as defined in Fig 1. (A) Schematic diagram of the regions of the small intestine and colon, as defined in [8]: Regions 1 (B) and 4 (E) are at 10% of the proximal-distal distance along the small intestine and colon, respectively; Regions 2 (C) and 5 (F) at 50%; and Regions 3 (D) and 6 (G) at 90%. Tissue from three mice was analysed for each age group, with 100–200 crypts counted in each region in each mouse. Error bars show standard deviations between mice. Values for percentage crypt fission are shown in S1 Table, and underlying data for panels B–G can be found in S1 Data.

