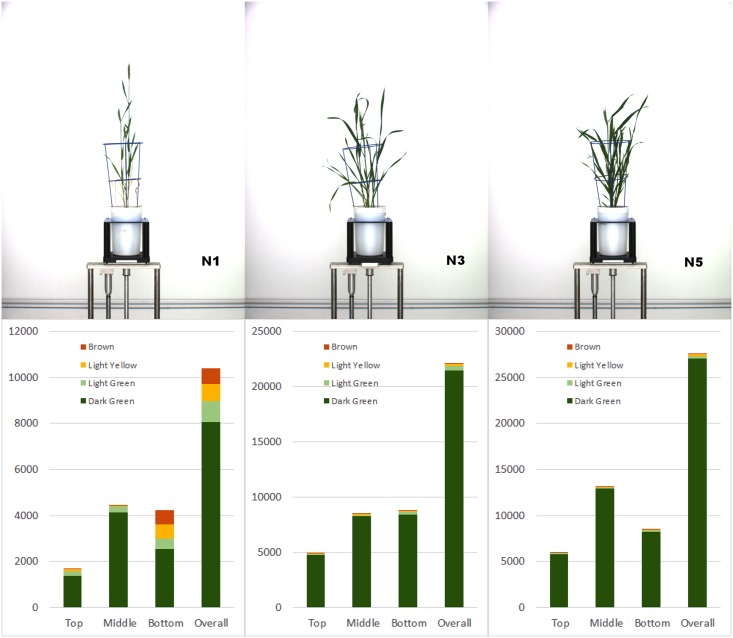
Fig 6. Zonal assessment of green versus senescence leaf areas in pixels.
Top figures show original images of three Gladius plants each grown under a different level of nitrogen (N1, N3 and N5). The bottom figures show the results of color classification in pixel area as a function of zone, according to our four-category color scheme: dark green, light green, yellow and brown.

