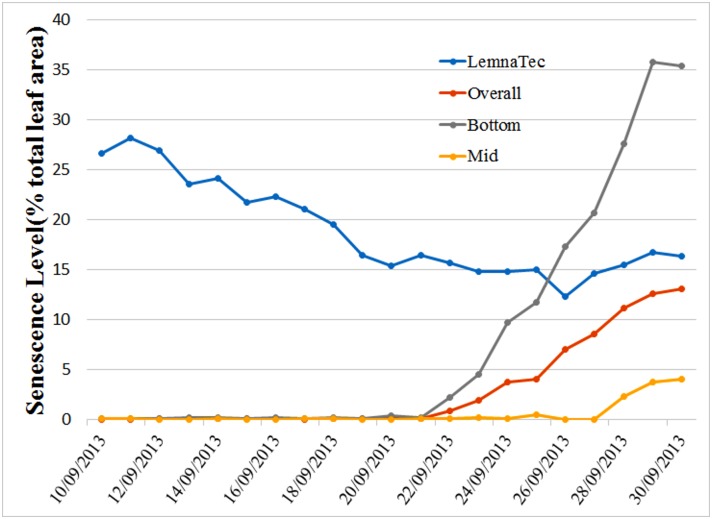
Fig 7. Comparison of senescence estimations using the method proposed here (curves denoted Overall, Mid and Bottom) and a direct application of the color analysis software provided by The Plant Accelerator’s LemnaTec imaging system.
For the Lemnatec results, only a whole-of-plant measure is available with which we compare a corresponding measure, which in turn is broken down into the senescence levels determined in the bottom and middle zones.

