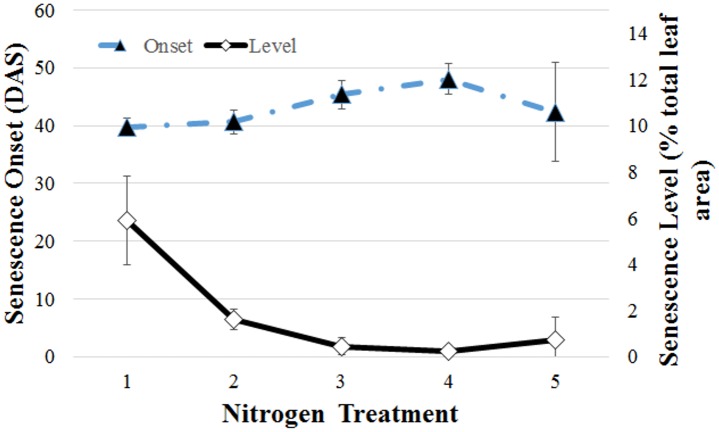
Fig 10. Summary of senescence dependence on nitrogen treatment (N1 − N5, horizontal axis) for the Gladius wheat plant variety.
Shown are mean values of onset determination (days after sowing, DAS, dashed curve and solid triangles, left vertical axis) and final degree of senescence (percentage of total project leaf area, solid curve and open diamonds, right vertical axis). Error bars show the variation across three repeats.

