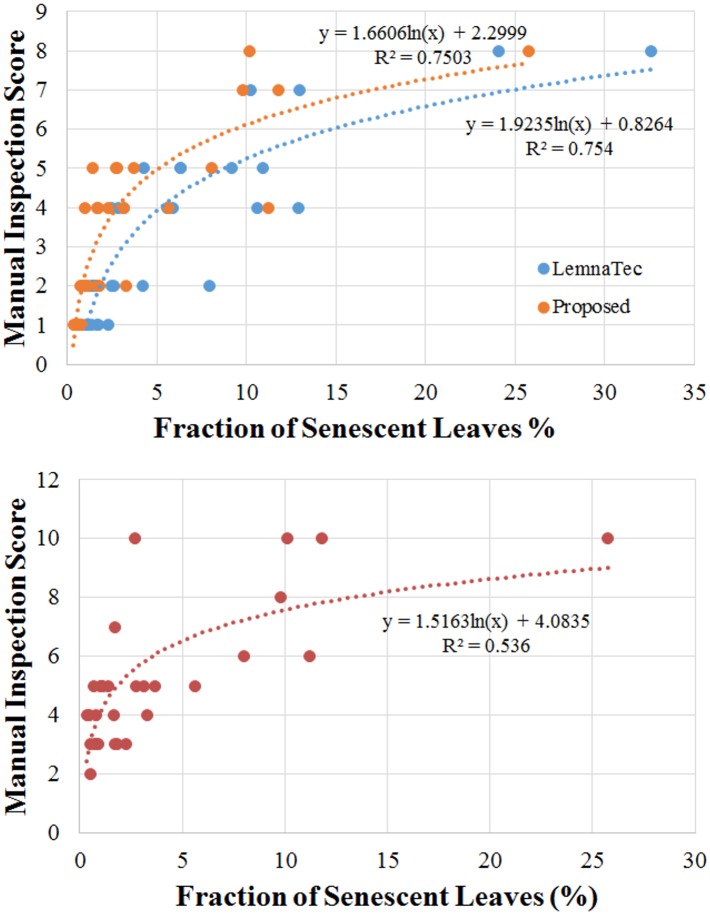
Fig 11. Scatter plots of manual inspection scores versus the objectively estimated senescence measure proposed in this paper and that of the machine learning method adapted by the LemnaTec system for a set of chickpea plants.
Manual scoring was performed on two occasions: 2 days after the last imaging day (top panel) and 3 days after the last imaging day (bottom panel).

