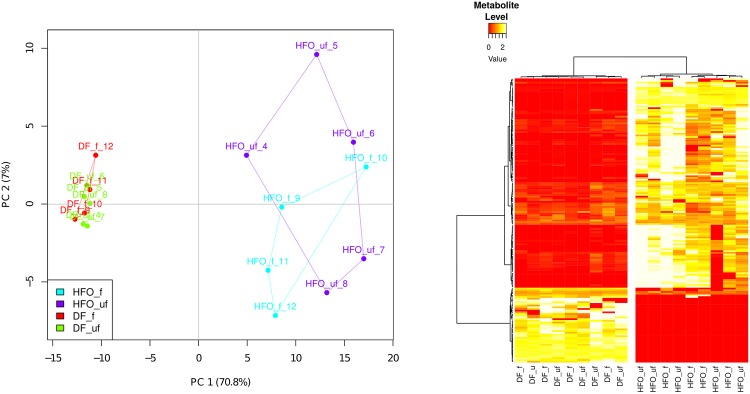
Fig 3. Metabolic profile of macrophages exposed to combustion aerosols.
(a) Principal Component Analysis shows separation of fuel types, but no separation by presence of particles. (b) Heatmap represents metabolites with significantly differing abundances between treatments (ANOVA test, p < 0.01). Data was batch normalized, and metabolites found in less than 80% of all treatments were removed. DF: Diesel Fuel, HFO: Heavy Fuel Oil, f: filtered aerosol exposure (n = 4), uf: unfiltered (complete) aerosol exposure (n = 5).

