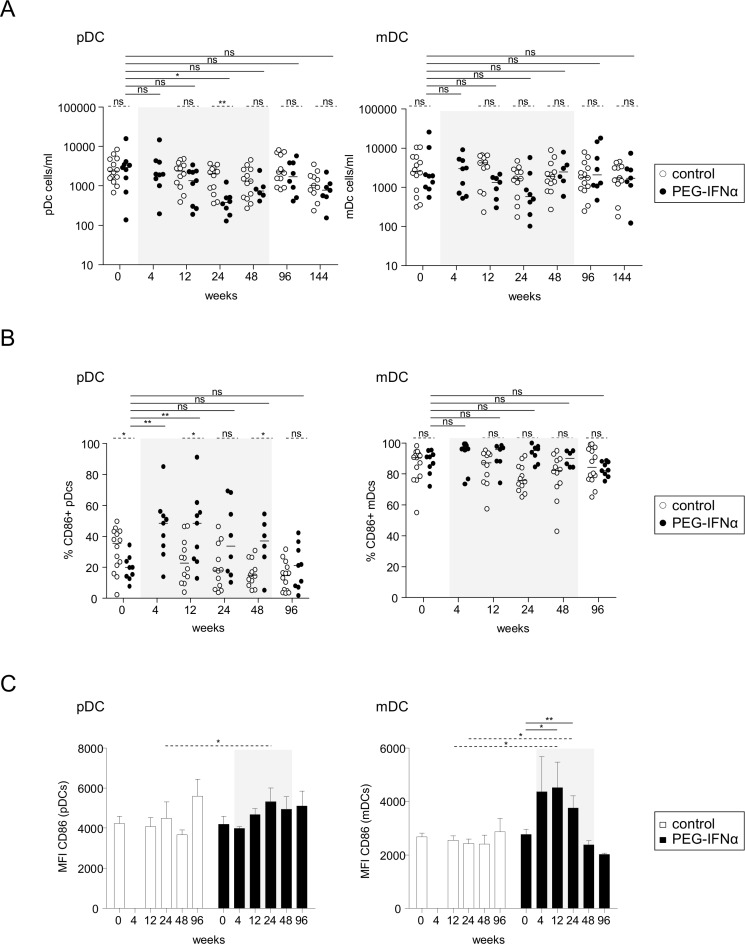
Fig 1. Modulation of DC subsets by Peg-IFN-α.
Patients with CHB infection were treated with NA alone (open circles, n = 11–14) or together with Peg-IFN-α (black circles, n = 7–9). DC subsets were analyzed by flow cytometry before and at different time points of treatment. (A) Absolute numbers of pDCs and mDCs. (B) Basal percentages of CD86 expression on pDCs and mDCs. (C) Mean fluorescence intensity of CD86 on pDCs and mDCs. CD86 was not evaluable for W144. The gray area represents the period of Peg-IFN-α administration. Bars represent median. P-values were calculated using the Wilcoxon test (straight lines) or the Mann-Whitney test (dashed lines). *p<0.05, **p<0.01, ***p<0.001.

