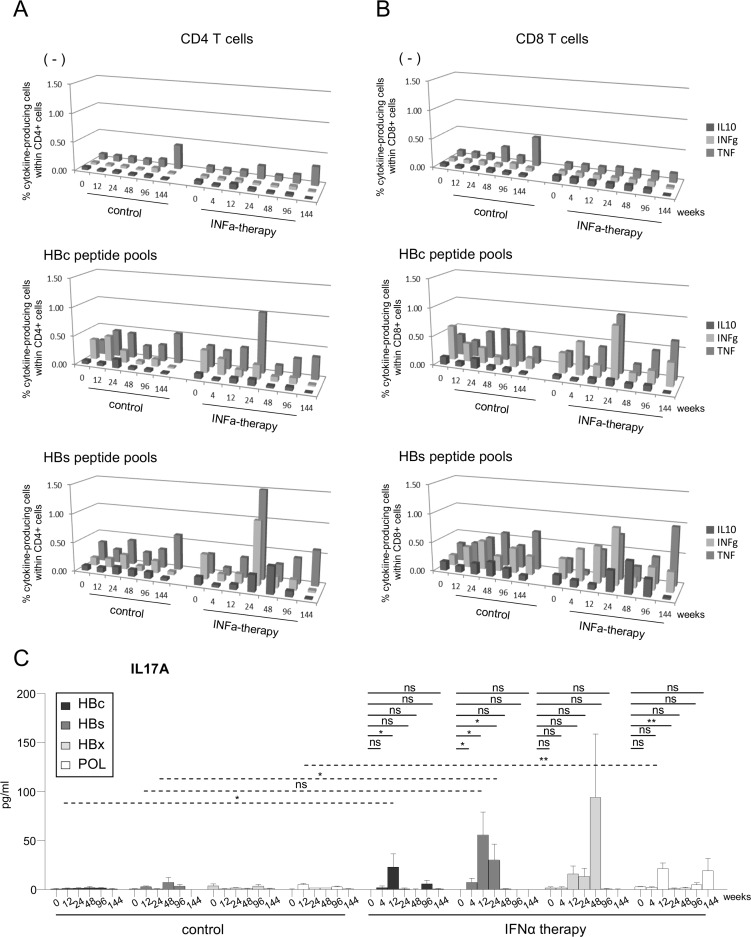
Fig 4. Frequencies and Th1/Th17 orientation of HBV-specific CD4/CD8 T cells during the course of Peg-IFN-α treatment.
(A-B) Frequencies of HBV-specific CD4/CD8 T cells were evaluated before and during Peg-IFN-α treatment upon the stimulation of PBMCs with peptide pools and intracellular TNF-α, IFN-γ and IL-10 cytokine staining from patients treated with NA alone (n = 5–8) or together with Peg-IFN-α (n = 3–5). (A) Frequencies of cytokine-producing HBc-/HBs-specific CD4 T-cell responses (mean values). (B) Frequencies of cytokine-producing HBc-/HBs-specific CD8 T-cell responses (mean values). (C) IL-17A production was analyzed in supernatants of PBMCs stimulated with peptide pools derived from the HBc, HBs, HBx and POL antigens before and during Peg-IFN-α treatment in patients with CHB infection treated with NA alone (n = 10) or together with Peg-IFN-α (n = 9). P-values were calculated using the Wilcoxon test (straight lines) or the Mann-Whitney test (dashed lines). *p<0.05, **p<0.01, ***p<0.001.

