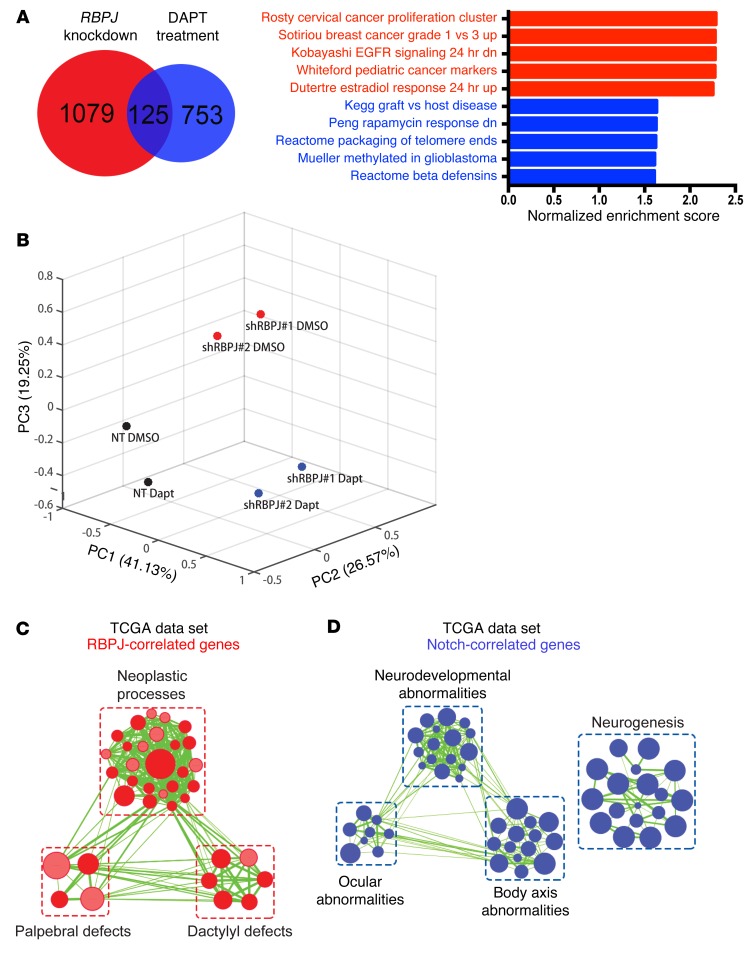
Figure 5. RBPJ induces transcriptional profiles in BTICs distinct from NOTCH activation.
(A) GSEA results from ranked genes in 3691 BTICs in which RBPJ was knocked down or treated with DAPT alone. Genes that exhibited at least a 1.5-fold decrease upon RBPJ knockdown or DAPT treatment compared to respective controls (nontargeting vs. DMSO). (B) The first three principal components and their loadings for 4121 BTICs based on RNA sequencing after transduction with either shCONT or shRBPJ and treatment with either vehicle control (DMSO) or DAPT treatment (5 μM). (C and D) Gene signature enrichment was analyzed using gProfiler (34) with genes whose RNA expression was most significantly correlated with (P < 0.001, r > 0.3) and mutually exclusive for (C) RBPJ or (D) NOTCH1 in the TCGA data set. Enriched gene sets for either gene were visualized via Enrichment Map on Cytoscape (35) for signatures with FDR < 0.001 and P < 0.005.

