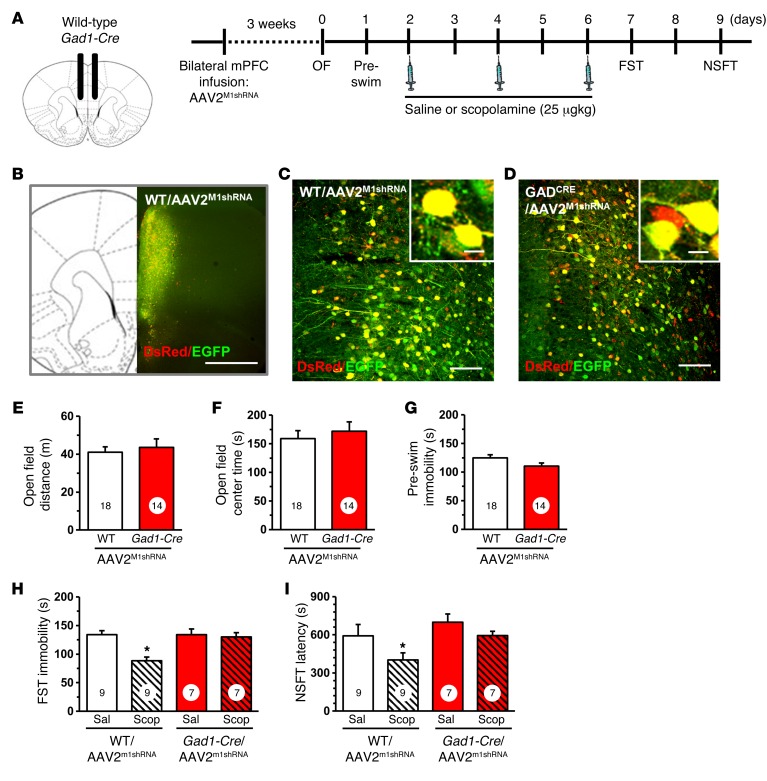
Figure 2. Infusion of AAV2M1shRNA in mPFC of Gad1-Cre mice blocked the antidepressant effects of scopolamine.
WT or Gad1-Cre mice received bilateral infusion of AAV2M1shRNA in the mPFC. After 3 weeks, mice were tested for baseline behavioral changes, then received saline or scopolamine, followed by additional behavioral tests. (A) Schematic showing experimental approach and time line. A subset of mice were perfused, and brains were processed for histology. Representative confocal images of fluorescence in the mPFC are shown. OF, open field. (B) Low magnification image in WT/AAV2M1shRNA mouse to show representative infusion in mPFC. Original magnification, ×4. Scale bar: 1 mm. (C) Representative image of AAV2M1shRNA in prelimbic mPFC of WT mouse. Original magnification, ×20. Inset shows all neurons have colocalization of eGFP (green) and DsRed (red) fluorescence. Scale bars: 100 μm; 10 μm (inset). (D) Representative image of AAV2M1shRNA in prelimbic mPFC of Gad1-Cre mouse. Original magnification, ×20. Scale bar: 100 μm. Inset shows some neurons have colocalization of eGFP (green) and DsRed (red) fluorescence, while others only have DsRed fluorescence. Scale bar: 10 μm. Prior to scopolamine treatment, mice were tested in open-field activity and FST (preswim). Total distance in the open field (E), time spent in center of open field (F), and time spent immobile in the preswim are shown (G) for each set of experiments. Following repeated doses of scopolamine, WT or Gad1-Cre mice were tested in FST and NSFT. Time spent immobile in the FST (H) and latency to feed in NSFT are shown (I). Scop, scopolamine; Sal, saline. Bars represent the mean ± SEM, n = 7–9/group. Numbers in the bars represent the total sample size for each group. *P < 0.05, means significantly different from the respective saline group based on ANOVA.

