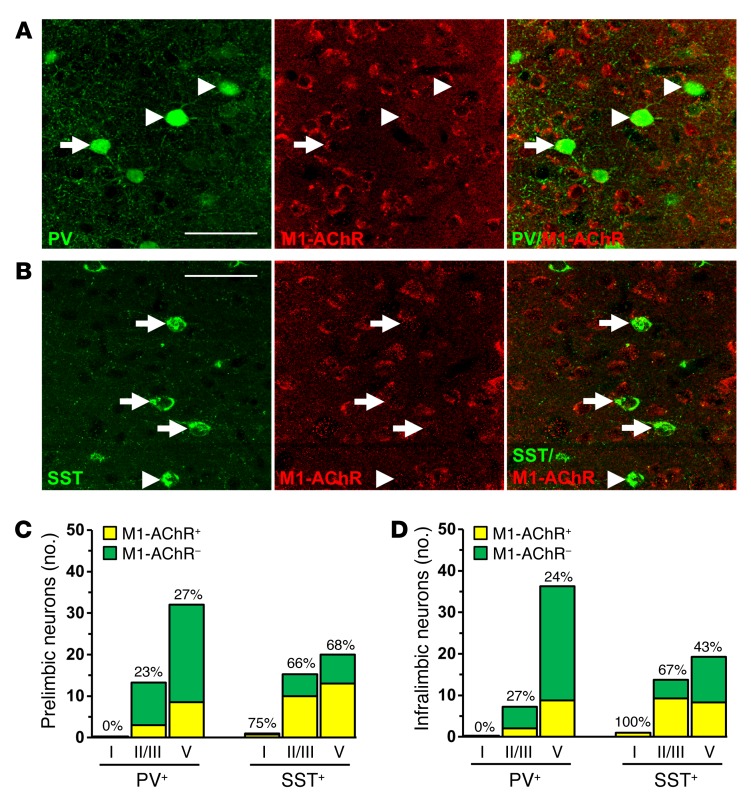
Figure 5. Parvalbumin and SST interneurons have varied expression of M1-AChR in the mPFC.
WT mice were perfused, and brains were processed for immunohistology. Representative confocal images of immunofluorescent labeling in the mPFC are shown. (A) Images of PV (green) and M1-AChR (red) in the mPFC are shown. Original magnification, ×40, zoom 2. (B) Images of SST (green) and M1-AChR (red) in the mPFC are shown. Original magnification, ×40, zoom 2. Scale bars: 50 μm. Arrows show interneurons colabeled for specific marker and M1-AChR, while arrowheads show interneurons that do not colabel with M1-AChR. (C and D) Number and proportion of PV and SST interneurons that colocalized with M1-AChR in layers I, II/III, and V of the (C) prelimbic or (D) infralimbic mPFC. Proportions represent the percentage of M1-AChR+ interneurons in each subpopulation and cortical layer indicated.

