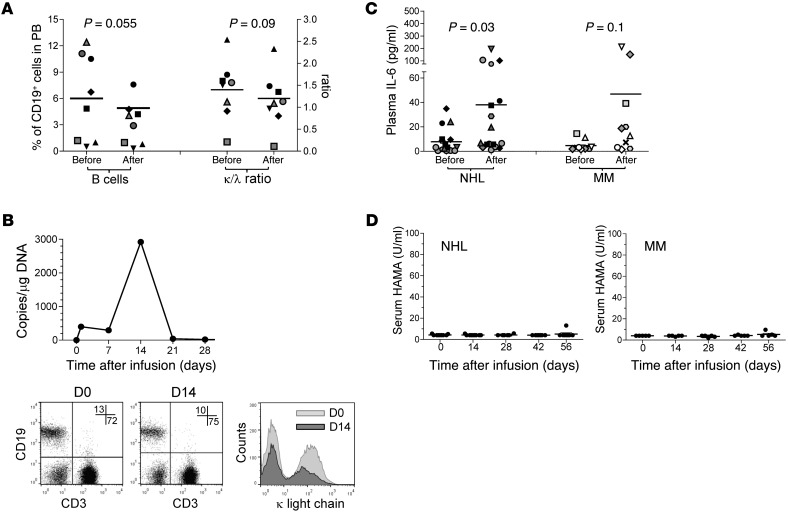
Figure 3. Biological effects observed after κ.CART infusion.
After κ.CART infusion, a transient decline in total B cell numbers and in the κ/λ ratio in MM patients (n = 8, paired Student’s t test) was observed (A). In general, there was a decrease in the mean fluorescence intensity of κ light chain expression during the first 2 weeks after κ.CART infusion; data from 1 representative patient are shown in B, with κ.CART expansion data in the top panel and κ light chain expression data in the bottom panels. Numbers in the dot plots correspond to the percentage of CD19+ (upper left quadrant) and CD3+ (lower right quadrant) PBMCs; histogram shows the distribution of the intensity of surface κ light chain staining in CD19+ PBMCs, highlighting the κ– (left peak) and κ+ (right peak) population, at each of the time points depicted. Inflammatory cytokines levels (shown for IL-6) increased modestly after κ.CART infusion (C), in both NHL (n = 17 infusions) and MM (n = 10 infusions) patients (paired Student’s t test), and no clinical evidence of CRS was observed. There was no significant generation of HAMAs after κ.CART infusion (D).

