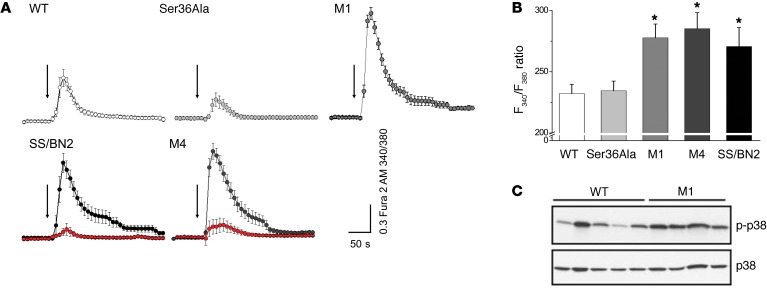
Figure 10. p66Shc actions mediate effect of ET-1 on changes in intracellular Ca2+ in renal SMCs derived from genetically modified rats.
(A) ET-1 produced dynamic changes in [Ca2+]i in SMCs. Presented are average time courses of [Ca2+]i changes in individual SMCs following exposure to ET-1 (100 nM, arrows) given as relative F340/F380 ratio. Number of cells analyzed for each strain was as follows: WT (n = 19), M1 (n = 51), Ser36Ala (n = 28), M4 (n = 16 in the absence of BQ123 and n = 13 in the presence of BQ123, marked in red), and SS/BN2 (n = 11 in the absence of BQ123 and n = 8 in the presence of BQ123, marked in red). ETRA inhibitor BQ123 was used at a concentration of 400 nM. (B) Total [Ca2+]i produced by cells treated with ET-1 calculated as integral from beginning of activation to the F340/F380 ratio level restitution. Comparison was performed using 1-way ANOVA with Bonferroni’s correction. M4, M1, and SS/BN2 groups were significantly different from WT and Ser36Ala groups. *P < 0.05. All summarized data are reported as mean ± SEM. (C) Increased activation of p38 MAPK in renal tissues derived from p66Shc-KO rats. Renal cortex tissues were lysed and subjected to WB analysis with antibodies that recognize phosphorylated forms of p38 MAPK. Expression levels of p38 MAPKs are also shown. Every lane corresponds to a separate animal. Rats were 26- to 28-week-old males (23–25 weeks on 1% salt diet).

