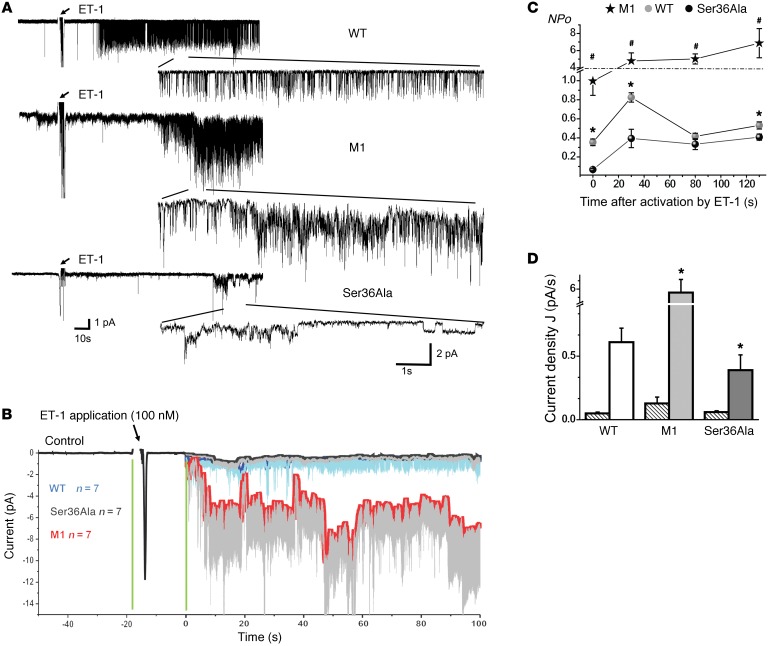
Figure 9. p66Shc actions mediate effect of ET-1 on TRPC channel activity.
(A) Representative single-channel traces on vascular SMCs before and after ET-1 treatment in cells derived from WT, M1, and Ser36Ala rats. All traces were recorded at –80 mV holding potential. Insets show 10-second single-channel recording intervals. (B) Point-wise comparison of means of single-channel amplitude changes after ET-1 application. Each curve represents the sum of 7 independent experiments. (C) ET-1 (100 nM) induces changes in TRPC channel activity (NPo). M1 is significantly different from WT or Ser36Ala (#P < 0.05). WT significance difference with Ser36Ala is also shown (*P < 0.05). (D) Changes in current density J, pA/s calculated as total current integral ratio to the first 100 seconds after activation start point. Ser36Ala significantly differs from WT. M1 significant increase versus WT or Ser36Ala is indicated. *P < 0.05. Striped bars represent control value before ET-1 application. All summarized data are reported as mean ± SEM. Data from before and after treatment within the same experiment were compared using the paired t test. Data from different experiments were compared with a Student’s t test (2 tailed) or 1-way ANOVA as appropriate.

