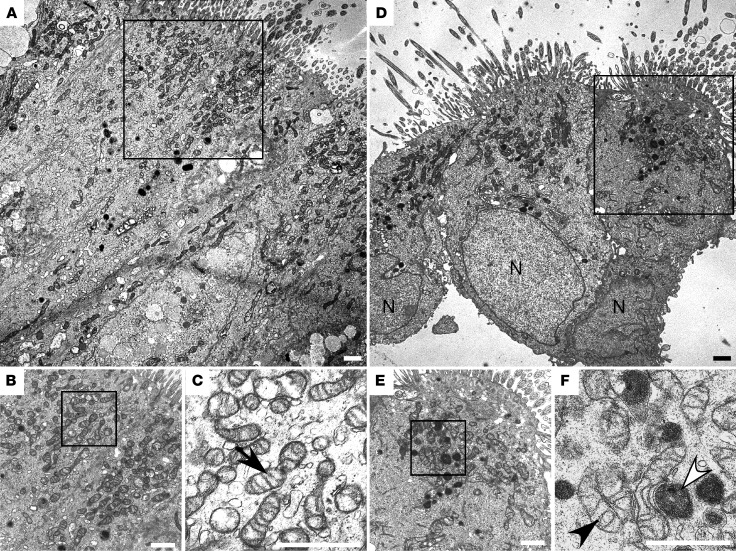
Figure 2. Ultrastructure of mitochondria in asthma airway epithelium.
Ultrastructural analyses of bronchial epithelium from control (A–C) and asthma (D–F). C, close-up view of A; B and F, close-up of D and E. Cilia are visible on cells (A and D). Mitochondria are concentrated in apical regions. High power reveals hyperdense mitochondria with tightly coiled inner membrane (F, white arrowhead) and lesser electron-dense mitochondria (F, black arrowhead) in asthma and control (C, arrow). Images representative of 4 asthmatics and 6 controls. N, nuclear. All scale bars: 1 μm.

