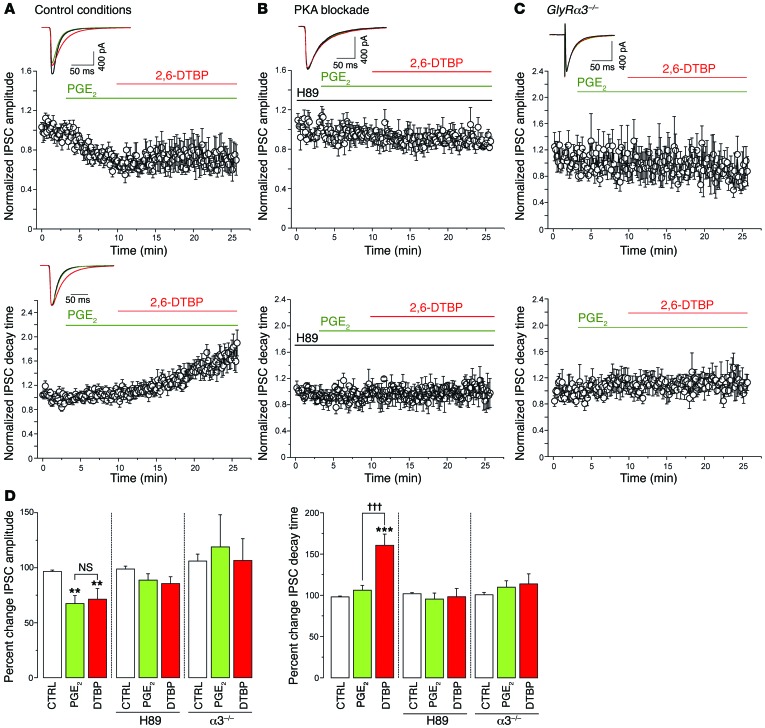
Figure 5. Pretreatment with PGE2 renders synaptic α3βGlyRs susceptible to modulation by 2,6-DTBP.
(A) Normalized amplitudes (mean ± SEM) (top panel) and decay time constants (bottom panel) of light-evoked Gly-IPSC traces versus time, before and during the application of PGE2 (1 μM) and in the additional presence of 2,6-DTBP (100 μM). Insets are example traces averaged from 10 consecutive stimulations under the three conditions (n = 12). (B) Same as (A) but preincubated with H-89 (5 μM) to prevent phosphorylation of GlyRs by PGE2 (n = 7). (C) Same as (A) but experiments done in slices taken from GlyRα3–/– mice. In these experiments, Gly-IPSCs were evoked by electrical field stimulation, n = 12. (D) Left panel: PGE2 reduced Gly-IPSC amplitudes in control slices but not in H89-treated slices or in slices from GlyRα3–/– mice, while 2,6-DTBP had no significant effects on Gly-IPSC amplitudes in either condition. **P = 0.01, significant versus control (CTRL). ANOVA followed by Bonferroni post-hoc test. F(2,35) = 8.58, F(2,18) = 1.76, and F(2,30) = 0.12 for Gly-IPSC amplitudes shown in A–C, respectively. Right panel: 2,6-DTBP significantly prolonged Gly-IPSC decay time courses in PGE2-treated wild-type slices, but not in slices pretreated with H89, or in slices prepared from GlyRα3–/– mice. ANOVA followed by Bonferroni post-hoc test. †††P < 0.001, significant versus PGE2; ***P < 0.001 significant versus control. F(2,35) = 15.66, F(2,18) = 0.20, and F(2,30) = 0.62 for experiments shown in A–C, respectively. n = 7–12 cells per group. All scale bars: 50 ms, 400 pA.

