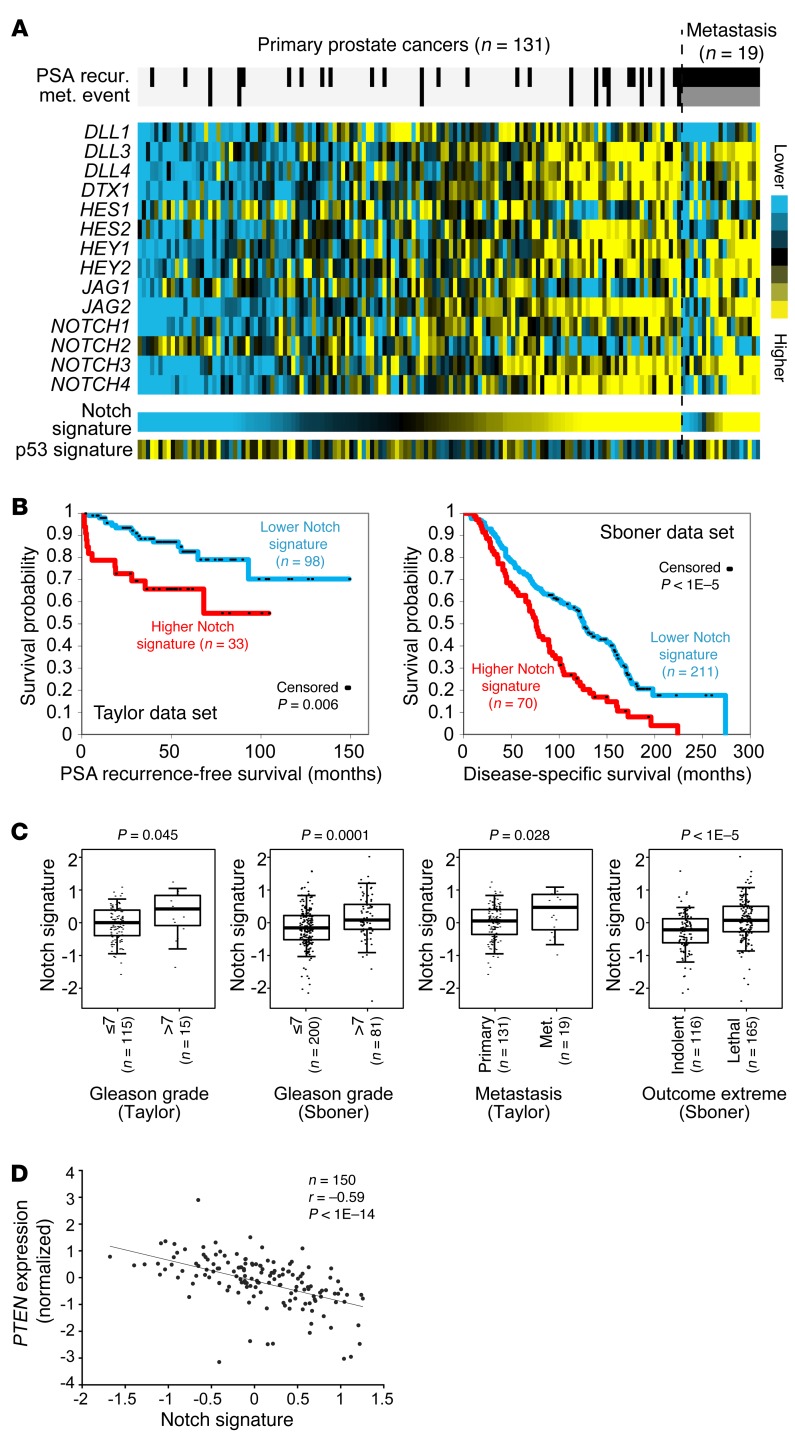
Figure 1. Higher Notch signaling predicts poor clinical outcomes.
(A) Expression heat map of mRNA expression for major Notch signaling components in the Taylor data set of prostate cancer specimens (22). Notch signature score was generated by averaging of the normalized expression values of the genes shown. A gene signature of p53 transcriptional targets (http://p53.iarc.fr/TargetGenes.aspx) is inversely correlated with the Notch signature as shown. (B) Kaplan-Meier plots for correlations of Notch signature with prostate cancer recurrence in the Taylor data set (22) (left) and survival in the Sboner data set (23) (right). Log-rank test: P < 1 × 10⁻⁵. (C) Box plots show correlations of Notch signature with increasing Gleason grade, metastatic potential, and lethal outcome. P values are by t test. Box plots represent 5%, 25%, 75%, median, and 95%. (D) Scatter plot shows an inverse correlation between Notch signature and PTEN expression levels (Spearman’s correlation, r = –0.59, P < 1 × 10⁻¹⁰).

