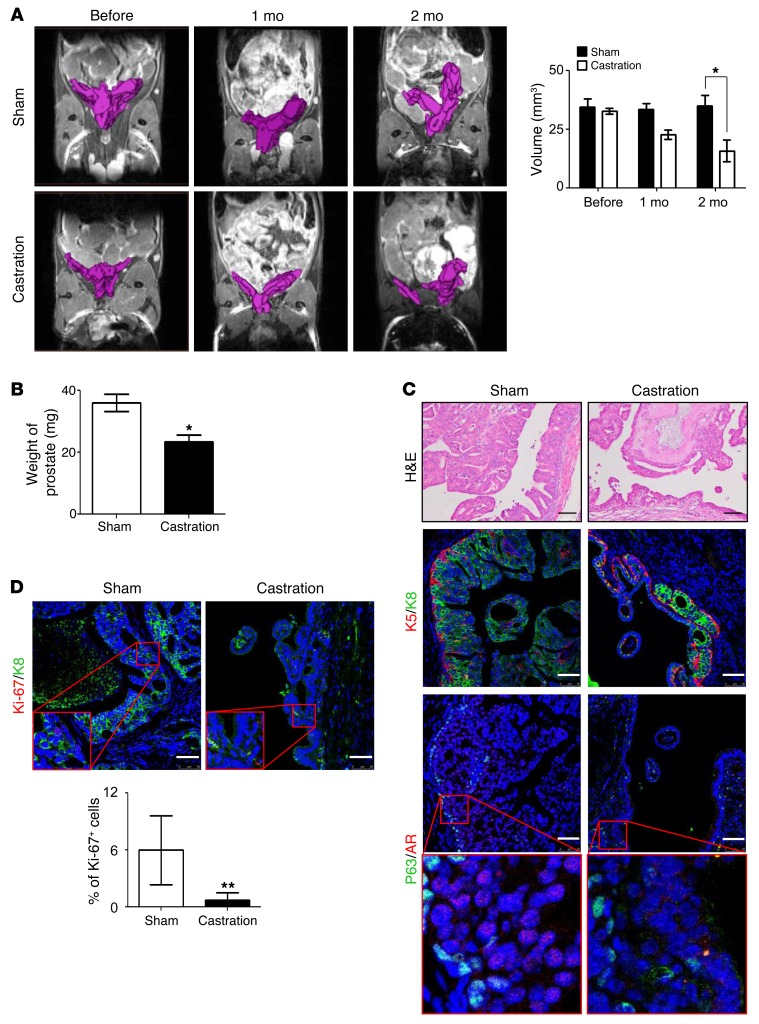
Figure 10. Notch activation does not confer capacity for castration resistance.
(A) Magnetic resonance imaging of PB-Pten-NICD prostate tissues before and after castration. Bar graph shows means ± SD of prostate volume based on MRI analysis. n = 3. (B) Bar graph shows prostate weight of mice 2 months after castration or sham surgery. n = 3. (C) H&E staining (top), coimmunostaining of K5 and K8 (middle), and P63 and AR (bottom) in prostate tissues of PB-Pten-NICD mice that underwent castration and sham surgery. Scale bars: 50 μm. (D) Coimmunostaining of Ki-67 and K8 in prostate tissues of PB-Pten-NICD mice that underwent castration and sham surgery. Scale bars: 50 μm. Bar graphs show means ± SD. *P < 0.05, **P < 0.01 by Student’s t test.

