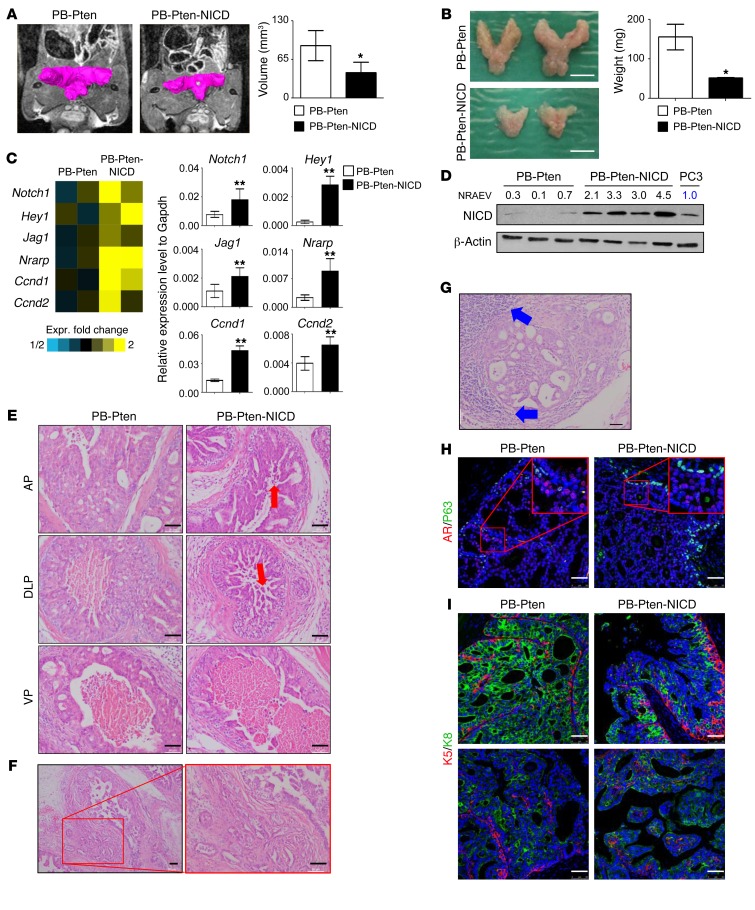
Figure 4. Notch activation results in a reduction of primary tumor burden in the Pten-null model.
(A) Magnetic resonance imaging of prostate tissues in PB-Pten and PB-Pten-NICD mice at 16 weeks of age. Bar graphs show means ± SD of tumor volume from 3 mice. *P < 0.05 by Student’s t test. (B) Representative images of prostate tissues from PB-Pten and PB-Pten-NICD mice at 16 weeks of age. Bar graphs show means ± SD of prostate weight from 3 mice per group. *P < 0.05 by Student’s t test. Scale bar: 5 mm. (C) Heat map from microarray data shows upregulation of representative Notch target genes in PB-Pten-NICD mouse prostates. qRT-PCR validates expression changes of representative genes in microarray analysis from 3 different samples per group. **P < 0.001 by Student’s t test. (D) Western blot analysis of NICD in prostate tissues of 16-week-old mice. Each lane represents an independent specimen. NRAEV, normalized relative arbitrary expression value by β-actin. (E) H&E staining of anterior (AP), dorsolateral (DLP), and ventral (VP) prostate tissues from 16-week-old PB-Pten and PB-Pten-NICD mice. Red arrows point to acini inside lumen. (F) H&E staining shows prostate adenocarcinoma in 32-week-old PB-Pten-NICD mice. (G) H&E staining shows lymphocytic infiltration (blue arrows) in prostate tumor tissues in 32-week-old PB-Pten-NICD mice. (H and I) IHC analyses of P63 and AR (H), K5 and K8 (I) in prostate tissues of 16-week-old PB-Pten and PB-Pten-NICD mice. Scale bars: 50 μm.

