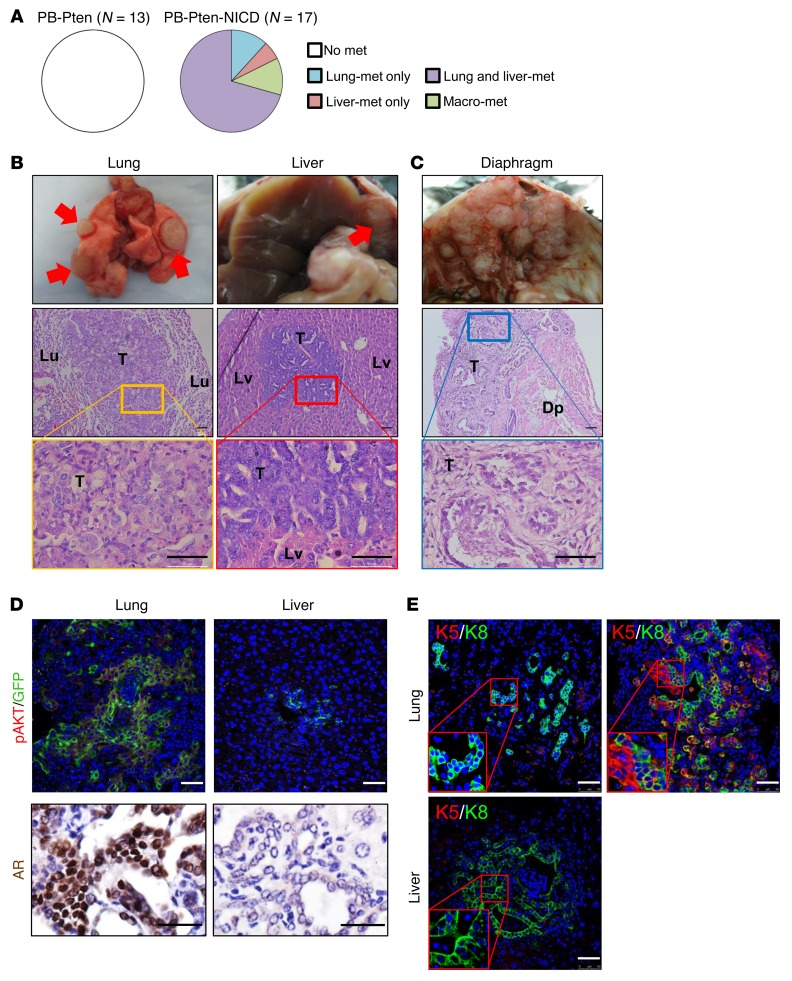
Figure 6. Notch activation promotes metastatic diseases in the Pten-null model.
(A) Pie charts summarize incidence of distal metastases in PB-Pten and PB-Pten-NICD mice. (B) Transillumination images of lung (Lu) and liver (Lv) with focal metastatic nodules (top) and H&E staining of the metastatic lesions (lower panels). (C) Transillumination image (top) and H&E staining (lower panels) of a diaphragm (Dp) colonized with metastatic lesions. T, tumor. (D) IHC analysis of pAKT, GFP, and AR in lung and liver metastases. (E) IHC analysis of K5 and K8 in lung and liver metastases. Scale bars: 50 μm.

