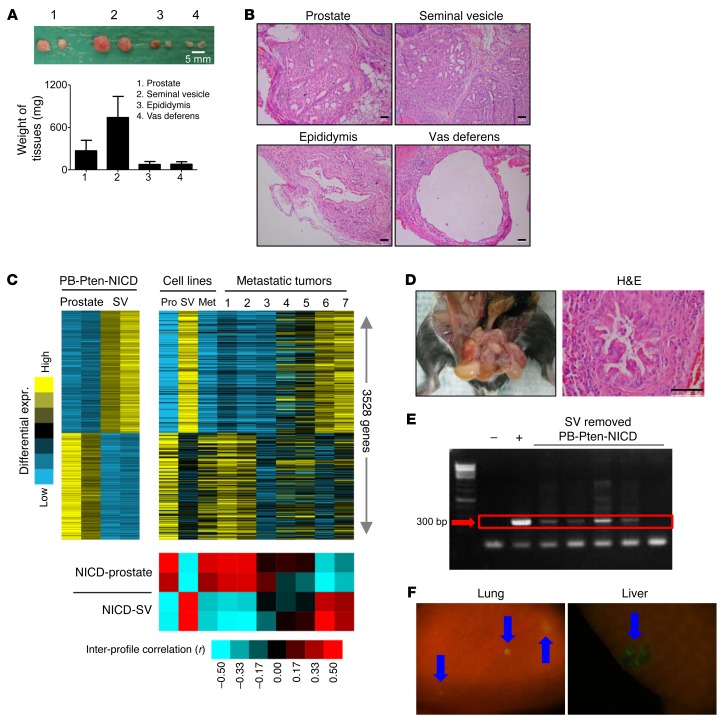
Figure 7. The prostate serves as a tissue of origin for lung metastases in the PB-Pten-NICD model.
(A) Image of xenografts outgrown from tissue fragments of prostates, seminal vesicles, epididymides, and vasa deferentia of 4-week-old PB-Pten-NICD mice. Bar graphs show means ± SD of tissue weight. (B) H&E staining of xenografts. (C) Heat map on the left shows 3,528 genes differentially expressed in prostate versus seminal vesicles (SVs) (fold 1.4 each prostate profile vs. each SV profile). Heat map on the right shows expression of these genes with the same gene ordering in 7 lung metastases and 3 cell lines derived from PB-Pten-NICD mice. Red-blue heat map shows intersample profile correlations based on the 3,528 genes (by Pearson’s coefficient; red, positive). (D) Left shows absence of seminal vesicles in a mouse that has undergone surgical removal of seminal vesicle. H&E staining (right) shows histology of prostate tissue from this mouse. (E) PCR analysis of Pten deletion allele in circulating blood cells of PB-Pten-NICD mice that have undergone seminal vesicle resection. (F) Fluorescent images of lung and liver tissues from a 34-week-old PB-Pten-NICD-mTmG mouse that has undergone surgical removal of seminal vesicles at 4 weeks of age. Blue arrows denote GFP-positive tumor foci. Scale bars: 50 μm.

