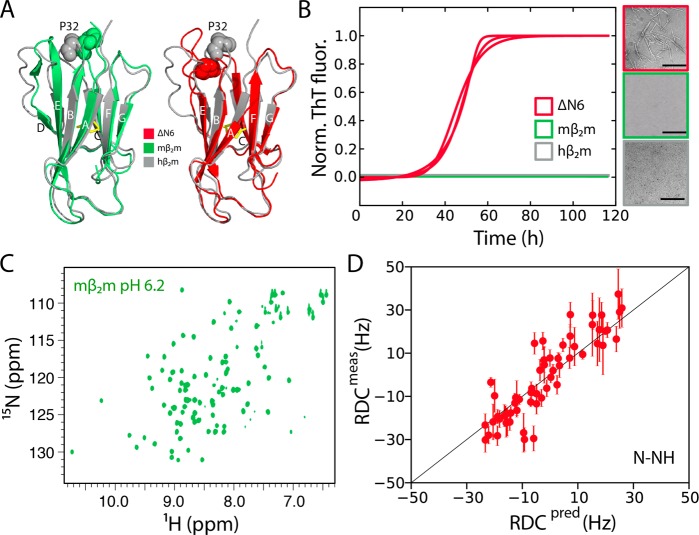
Figure 1.
Structure and amyloidogenicity of mβ2m. (A) The NMR structure of monomeric hβ2m (gray-2XKS28) overlaid with the crystal structure of mβ2m bound to the MHC-I complex (green-1LK238) or with the solution structure of ΔN6 (red-2XKU28). (B) Aggregation assay of 80 μM hβ2m (gray), mβ2m (green), or ΔN6 (red) in 10 mM sodium phosphate buffer, pH 6.2 (three replicates for each protein). Negative stain electron micrographs, color-coded with the same scheme, are shown on the right (scale bar = 500 nm). (C) The 1H–15N HSQC spectrum of mβ2m in the same buffer as (B). (D) Correlation between experimental RDCs measured for mβ2m in 10 mg/mL phage PF1 and those back-calculated from the crystal structure 1LK238 (R2 = 0.85).

