Figure 3.
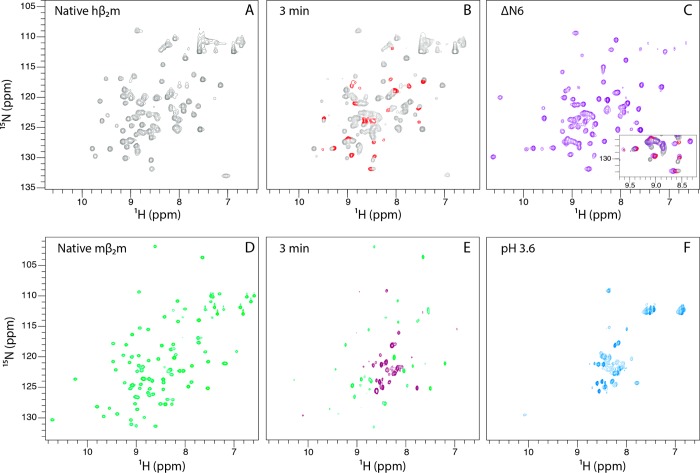
Folding of hβ2m and mβ2m in real-time. (A) 1H–15N SOFAST HSQC spectrum of native hβ2m in 10 mM sodium phosphate pH 6.2. (B) The 1H–15N SOFAST HSQC spectrum of hβ2m collected 3 min after refolding was initiated by urea dilution. Peaks that are already in their native positions are colored gray, while peaks with non-native chemical shifts are shown in red. (C) The 1H–15N HSQC spectrum of ΔN6 closely resembles the spectrum of the real-time folding intermediate of hβ2m. An overlay of the spectra shown in B and C is shown as an inset. (D) 1H–15N HSQC spectrum of native mβ2m in 10 mM sodium phosphate pH 6.2. (E) The 1H–15N BEST-TROSY-HSQC of mβ2m collected 3 min after refolding was initiated by urea dilution. Peaks that are already in their native positions are colored green while peaks with non-native chemical shifts are shown in purple. (F) The 1H–15N HSQC spectrum of mβ2m at pH 3.6 closely resembles the spectrum of the real-time folding intermediate of mβ2m.

