Figure 4.

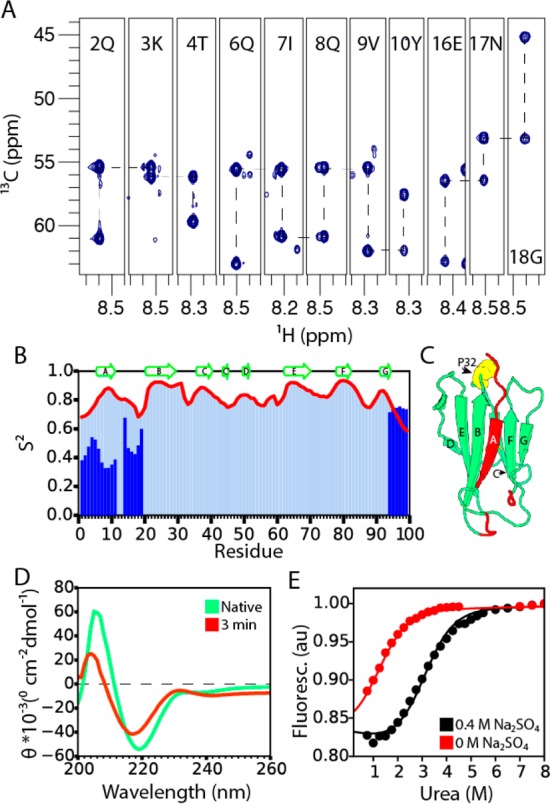
The early folding intermediate of mβ2m. (A) The assignment walk on the Cα atoms of the real-time BEST-HNCA spectrum of mβ2m collected 5 min after refolding was initiated by urea dilution at pH 6.2. (B) Predicted S2 parameters for the folding intermediate of mβ2m. The intense peaks shown in Figure 3E are shown in dark blue. The S2 parameters of the native state are shown as light blue bars and as a red line. (C) Residues observed in the real-time spectrum of the folding intermediate are highlighted in red in the structure of mβ2m. Pro 32 is shown as yellow spheres. (D) Far-UV CD spectra of native mβ2m at pH 6.2 (green) and of the folding intermediate 3 min after folding was initiated by a pH jump from pH 2.0 to pH 6.2 (red). (E) Normalized fluorescence signal at the end of each stopped-flow transient (20 s) as a function of urea concentration for mβ2m in the absence (red) or presence (black) of 0.4 M sodium sulfate. The data were fitted globally to a two-state model (see Methods).
