
Figure 6.
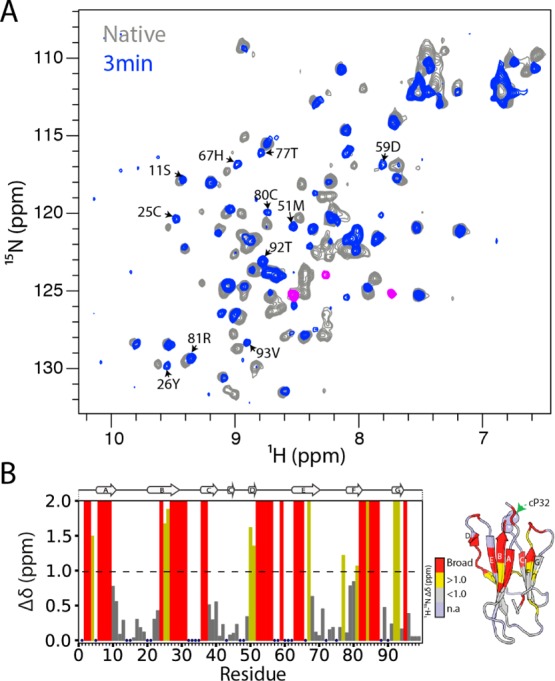
Detection of a native-like folding intermediate for mβ2m. (A) The 1H–15N SOFAST HSQC spectrum of mβ2m collected 3 min after refolding was initiated from the partially folded state at pH 3.6 (blue), overlaid with the 1H–15N SOFAST HSQC of native mβ2m (collected after 90 min) (gray). Peaks corresponding to the molten globule I1 state are colored in pink. (B) Per residue combined 1H–15N chemical shift differences between the native and the IT state of mβ2m, using the spectra displayed in (A). Blue dots represent residues for which assignments are missing in the native spectrum. Residues that show chemical shift differences greater than 1 ppm (dashed line) are colored yellow, those that show chemical shift differences less than 1 ppm are shown in gray, and residues that are broadened beyond detection in the 3 min spectrum are colored red. The strucure of mβ2m colored in the same color scheme is shown on the right.