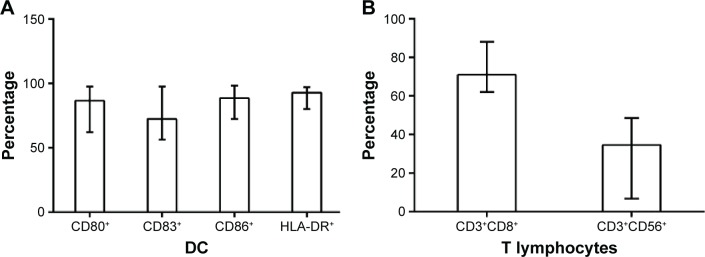
Figure 1.
Phenotypic analysis of DC and T-cells.
Notes: (A) Percentages (and range) of CD80+, CD83+, CD86+, and HLA-DR+ DCs were 86.52% (62.13%–97.54%), 72.48% (56.48%–97.66%), 88.64% (72.38%–98.33%), and 92.84% (80.12%–97.24%), respectively. (B) Median percentages (and range) of CD3+CD8+ T-cells and CD3+CD56+ NKT cells of T lymphocytes were 71.02% (62.13%–88.14%) and 34.62% (6.73%–48.57%).
Abbreviations: DC, dendritic cell; NKT, natural killer T-cells; HLA-DR, human leukocyte antigen-DR.

