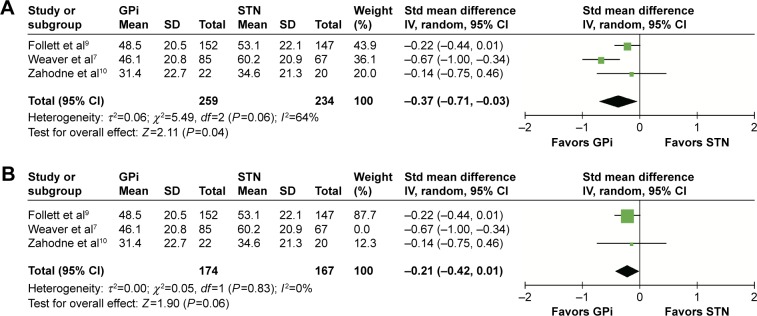
Figure 8.
Forest plot of standardized mean difference of the subscale “communication”.
Notes: (A) GPi had lower score and the difference was significant. But the heterogeneity between studies was substantial. (B) The heterogeneity reduced greatly (I2=0%, P=0.06) when the study “Weaver et al7” was excluded.
Abbreviations: GPi, globus pallidus interna; STN, subthalamic nucleus; IV, inverse variance; CI, confidence interval; Std, standardized.

