
Figure 2.2.
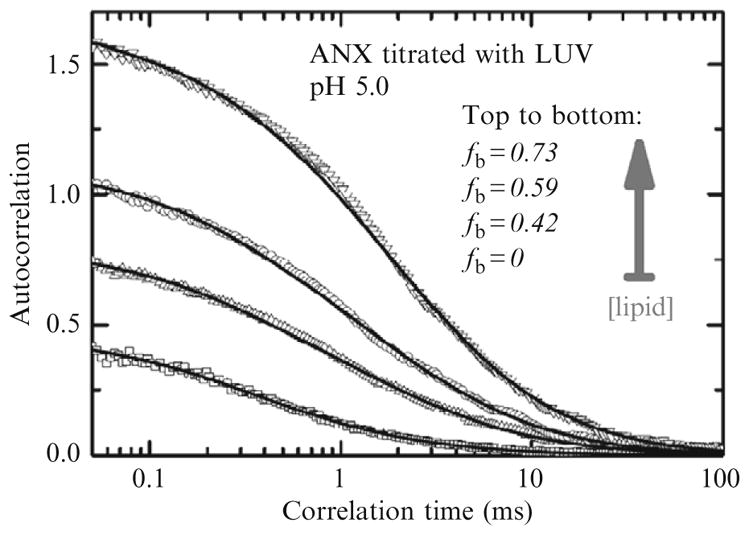
Example of lipid titration measurement using FCS performed outside of the “infinite dilution regime.” Correlation curves (symbols) were measured for samples containing 1 nM ANX and no LUV or LUV with 1, 2, and 4 μM of total lipid LUV (bottom-to-top). Progressive vesicle binding of fluorescently labeled ANX results in a reduction of the number of fluorescent particles in the focal volume and a corresponding increase in total autocorrelation amplitude. Solid curves correspond to fit with Eq. (2.3) (or Eq. (2.1), for sample containing no LUV). The fractions of bound ANX fb are calculated by comparing absolute amplitudes in the presence and absence of LUV (Eq. (2.6)). Reproduced from Posokhov et al. (2008a) with permission.