Figure 4.
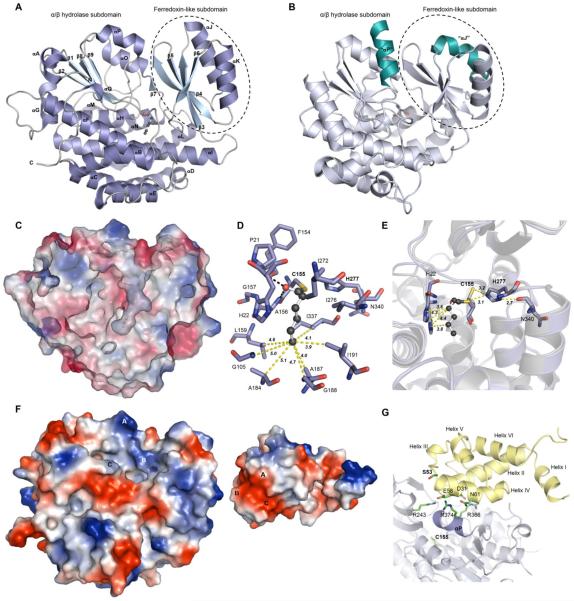
Crystal structure of the CazM SAT domain. A) The monomeric SAT domain consists of a large subdomain containing an α/β-hydrolase-like fold and a small subdomain containing a ferredoxin-like fold. B)Structure of the avermectin AT loading domain Ave-AT° (PDB 4RL1).19 The two teal helices indicate a change in orientation compared to αJ and αP in the SAT structure and the active site S120 is shown as a stick. C) Electrostatic surface representation of the SAT domain showing a cross section of the cavity leading to the active site and bound hexanoyl. D) Residues located within 5 Å of bound hexanoyl and distances of residues lining the bottom of the active site cavity to C6 of hexanoyl (yellow dashed lines). Polar contacts are shown as black dashes. E) Active site residue comparison between the apo and hexanoyl-bound SAT. The apo SAT residues are shown in gray, whereas the hexanoyl-bound residues are shown in purple. Bound hexanoyl is shown in ball and stick form. F) Electrostatic surface maps of the apo-SAT (left) and CazF ACP (right) docking interfaces. Colors range from blue (positive) to white to red (negative). The homology model for CazF ACP was generated using I-TASSER34 and docking simulations were performed with PatchDock.35 TheACP is rotated 180° such that A–C on the SAT and ACP interfaces should match up. On the SAT, A is R374, B is R243 and C is R366. On the ACP, A is N61, B is E58 and C is D31.G) The homology model of CazF ACP (colored in yellow) was used as a ligand protein to dock with the apo SAT structure (colored in white). Helix αPof the SAT is highlighted in purple and surface residues that may be responsible for protein-protein interaction are shown as sticks. The active site Ser in the ACP and Cys in the SAT are in bold. All electrostatic surface maps were generated using PyMOL.32

