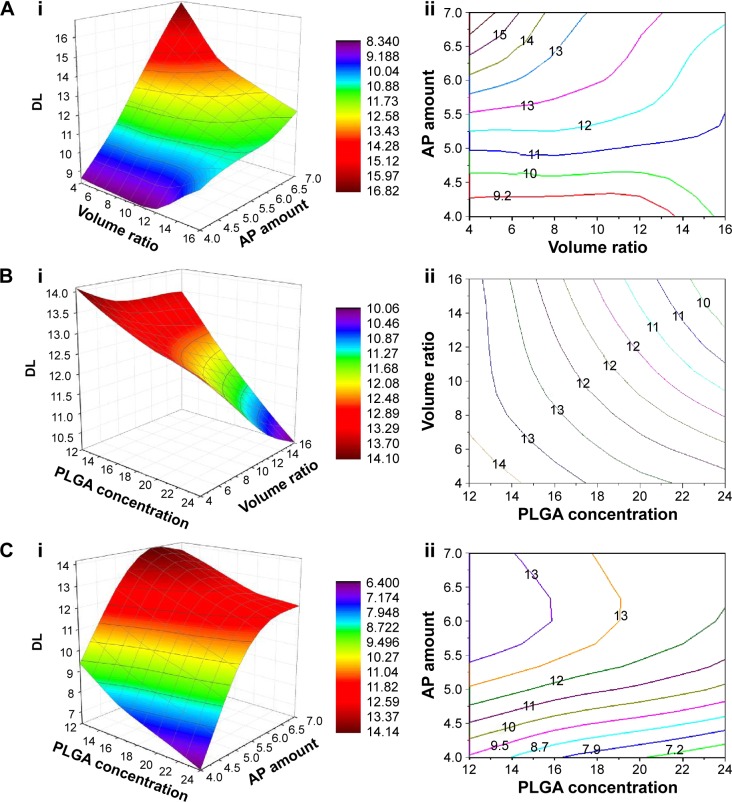
Figure 3.
Response surface and contour plots showing the effects of the PLGA concentration, the volume ratio of the aqueous phase to the oil phase, and the AP feeding amount on the DL.
Notes: (A) PLGA concentration kept constant at 18 mg/mL; (B) AP amount kept constant at 5.5 mg; (C) volume ratio of the aqueous phase to the oil phase kept constant at 10. i) Response surface plot; ii) contour plot.
Abbreviations: AP, acetylpuerarin; DL, drug loading; PLGA, poly(lactide-co-glycolide).

