
Figure 4.
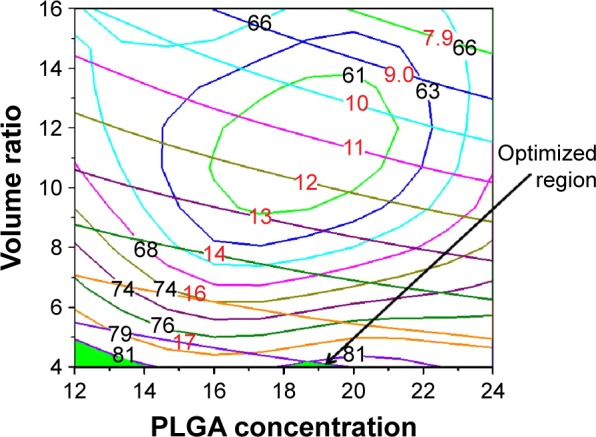
Overlaid contour plots showing the effects of the PLGA concentration and the volume ratio of the aqueous phase to the oil phase on the DL and EE.
Notes: The green regions represent the common parts of the overlaid DL and EE contour plots. The green region on the right was the optimized area for both the DL and the EE.
Abbreviations: DL, drug loading; EE, encapsulation efficiency; PLGA, poly(lactide-co-glycolide).