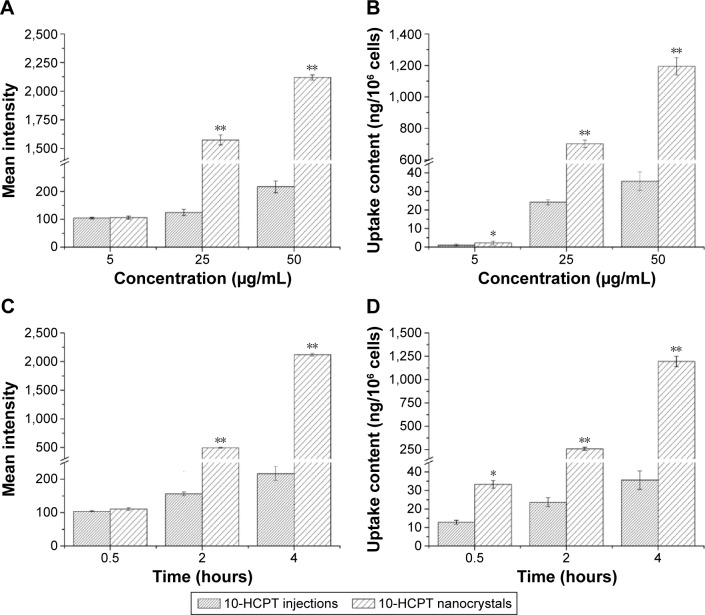
Figure 7.
Mean fluorescent intensity and amount of drug taken up by the 4T1 cells.
Notes: (A, B) The cells were incubated with different concentrations of 10-HCPT for 4 hours, (C, D) or were incubated with 50 μg/mL of 10-HCPT for different times. The results are presented as mean ± SD, n=3. *P<0.05, **P<0.001.
Abbreviations: 10-HCPT, 10-hydroxycamptothecin; SD, standard deviation.

