Figure 1.
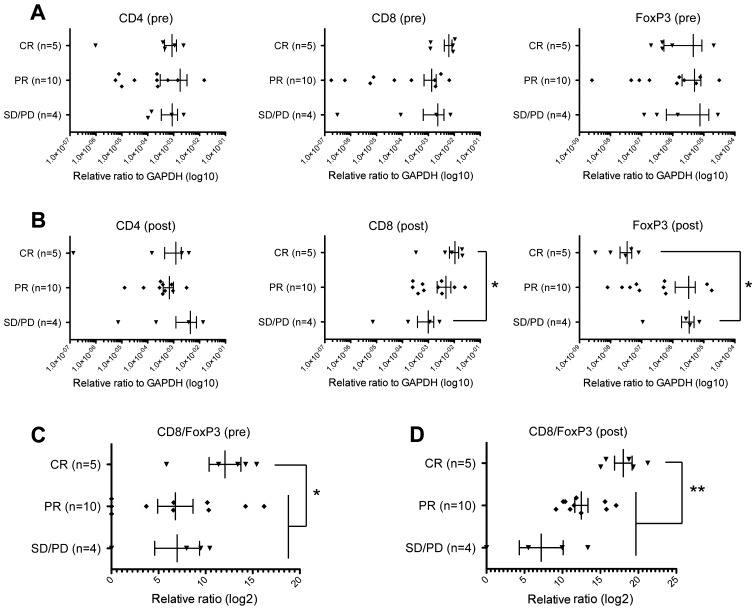
Expression changes of CD4, CD8, and FoxP3 in tumors. Expression levels of CD4, CD8, and FoxP3 were graphed according to tumor samples of pre-chemotherapy (A) or post-chemotherapy (B). The x-axis indicates expression level of each gene relative to that of GAPDH. The expression ratios of CD8 and Foxp3 were graphed in the tumor samples of pre-chemotherapy (C) or post-chemotherapy (D). Vertical lines represent the means ± standard deviations, and asterisks indicate *p<0.05 or **p<0.01.

