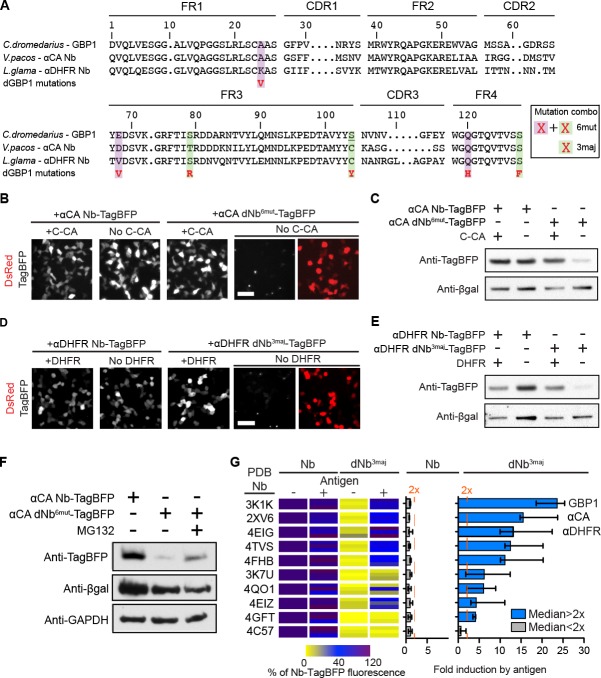
Figure 2. dGBP1 destabilizing mutations can be transferred to Nbs derived from different species to create antigen-dependent stability.
(A) Protein alignment of Nbs against GFP (GBP1), HIV-1 CA (αCA) and E.coli DHFR (αDHFR). Amino acid positions numbered according to the ImMunoGeneTics information system (IMGT). FR, framework; CDR, complementarity determining region. Purple- and green-highlighted residues indicate dGBP1 mutation position. Green-highlighted residues (3maj) are most destabilizing when mutated. The underlined serine was a cysteine in the original GBP1. (B–E). Transfer of dGBP1 mutations to other Nbs. Destabilized, but not unmodified αCA and αDHFR showed antigen-dependent fluorescence (B,D) as well as protein level (C,E). DsRed (red) indicates transfected cells in (B,D) and is only shown when TagBFP (gray) results are negative. Scale bar, 50 μm. (F) A dNb generated by mutation transfer was degraded by the UPS. αCA-dNb6mut-TagBFP showed an increase in protein level when transfected 293T cells were treated with MG132 for 6 hr. Results representative of 3 independent experiments. (G) Heat map showing median TagBFP fluorescence intensity of Nb-TagBFP fusions. All Nbs shown recognize epitopes of intracellular origin. Fluorescent readings were normalized to that of unmodified Nb (no antigen) condition, which was set to 100. n = 3 biological replicates pooled from 3 independent experiments per Nb. Each biological replicate result is shown as a horizontal bar in the heat map. Bar graphs indicate median and maximum-to-minimum range. Additional data related to mutation transfer of destabilizing mutations are shown in Figure 2—figure supplements 1–3. Source data for % Nb-TagBFP fluorescence values are shown in Figure 2—source data 1.
DOI: http://dx.doi.org/10.7554/eLife.15312.006


