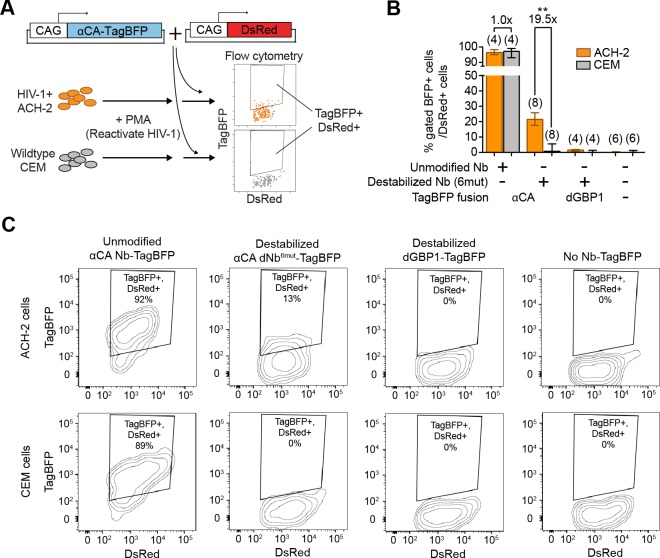
Figure 6. Detection of HIV-1 reactivated cells with a CA-specific sensor.
(A) Schematic showing isolation of HIV-1 cells via flow cytometry using αCA-specific, dNb sensor. Both ACH-2 (HIV+) and CEM (HIV-) cells were treated with 10 nM PMA prior to transfection of sensors. CAG-DsRed was a transfection marker. (B) Destabilized, but not unmodified αCA Nb enabled selective isolation of reactivated HIV-1 cells using flow cytometry (P = 0.0009 for comparison between destabilized αCA, ACH-2 vs. CEM). Plot shows median and maximum-to-minimum range. The number of biological replicates (equal to number of independent experiments) for each condition is shown in parentheses. **p<10–3, Mann-Whitney test. (C) Example of flow cytometry gating to isolate HIV-1 cells based on expression of CA. Cell populations are represented as log contour maps. Percentages of DsRed+ cells that were TagBFP+ are indicated for each condition. All cell populations were gated for DsRed expression. Results shown are representative of the number of biological replicates indicated in (B). Additional data related to HIV-1 sensors are shown in Figure 6—figure supplement 1.


