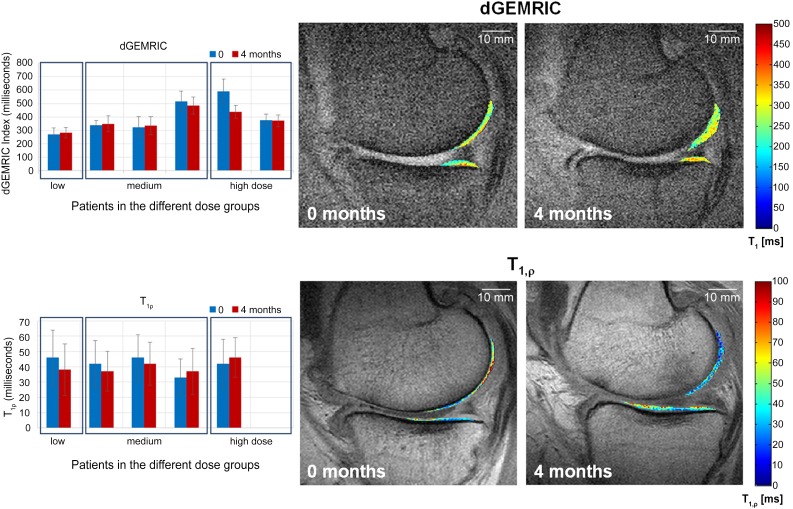
Figure 3.
dGEMRIC and T1rho magnetic resonance imaging (MRI) of selected patients. The graphs on the left show the dGEMRIC (n = 6) and T1rho (n = 5) values before and 4 months after cell therapy. Increasing dGEmRIC and decreasing T1rho values are each known to correspond to increasing glycosaminoglycan/proteoglycan content and thus improved cartilage condition. On the right, the corresponding dGEMRIC and T1rho maps are shown as a color-coded overlay on an anatomical MRI for a patient receiving a low cell dose. The observed values in the cartilage change in the time course can be easily seen and correspond to an increase in cartilage condition. Abbreviation: dGEMRIC, delayed gadolinium-enhanced magnetic resonance imaging of cartilage.

