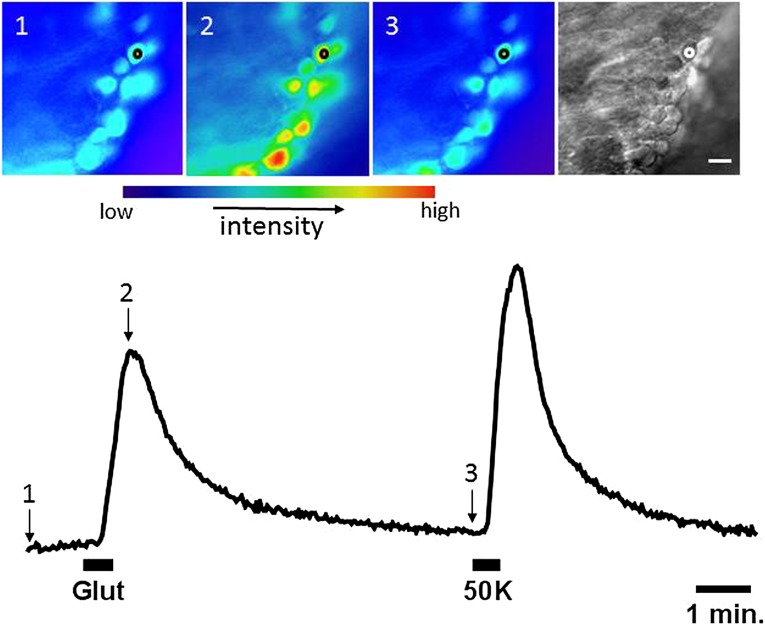
Figure 4.
Physiologic response of cells within a cerebral organoid derived from control human induced pluripotent stem cell line WT1 to glutamate and potassium (K+). Intracellular calcium concentration increased upon bath application of glutamate (100 µM) and elevated potassium concentration (50 K; 50 mM). Upper: False color images showing Fluo-3 fluorescence intensity before (1), at the peak (2), and after recovery (3) from the response to glutamate. Image at far right is an IR transmitted light image of the same field. Scale bar = 10 µm. Lower: Plot of fluorescence intensity over time showing Fluo-3 fluorescence in the region indicated by the circle on the images above. Glutamate and elevated potassium were bath applied during the times indicated by the black bars. Abbreviation: Glut, glutamate.

